4 · Model (exercises) — source
A. Stamm 
This page shows the source file of the exercise below. Use the button to download it as a plain file and run it in your own workspace.
---
title: "Models"
format:
html:
eval: false
---
```njjizuibn
#| include: false
library(tidyverse)
library(modelr)
library(broom)
# Import wages here
# Fall back in case you cannot load wages
# wages <- heights |>
# filter(income > 0) |>
# mutate(
# marital = as.character(marital),
# sex = as.character(sex)
# )
```
## Your Turn 1
* Change the working directory to the folder where `wages.xlsx` is located and
this file is saved.
* Then import `wages.xlsx` as wages and *copy the code to your setup chunk*.
* Be sure to set `NA:` to `NA`.
* Switch the `eval` option in the YAML header to `true`.
## Your Turn 2
- Fit the model
$$
\log(\text{income}) = \beta_0 + \beta_1 \cdot \text{education} + \epsilon
$$
- Store the result in an object called `mod_e`.
- Examine the output. What does it look like?
```rgr
```
## Your Turn 3
Use a pipe to model `log(income)` against `height`. Then use **broom** and
**dplyr** functions to extract:
1. The **coefficient estimates** and their related statistics
2. The **adj.r.squared** and **p.value** for the overall model
```rgr
```
## Your Turn 4
Model `log(income)` against `education` and `height` and `sex`. Can you
interpret the coefficients?
```rgr
```
## Your Turn 5
Add `+ geom_smooth(method = lm)` to the code below. What happens?
```rgr
wages |>
ggplot(aes(x = height, y = log(income))) +
geom_point(alpha = 0.1)
```
## Your Turn 6
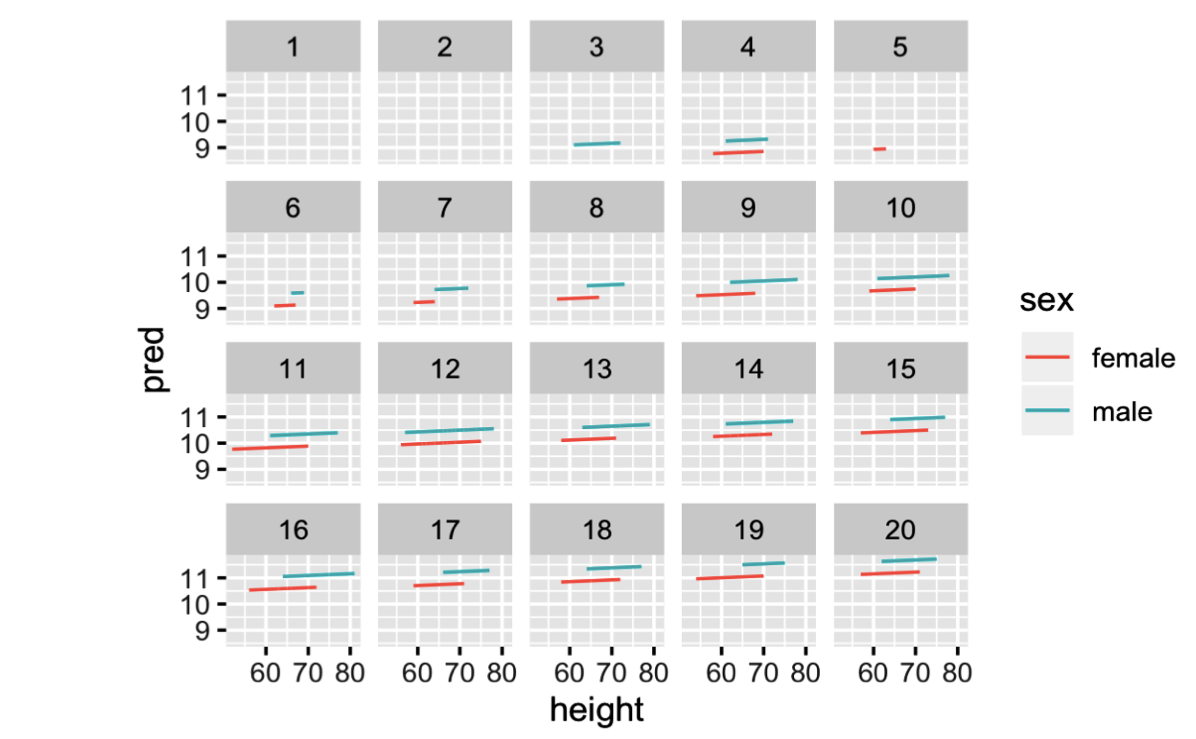
Use `add_predictions()` to make the plot below. Facetting is by level of
education.
```rgr
#| warning: false
#| message: false
# In case you haven't made the ehs model
mod_ehs <- wages|>
lm(log(income) ~ education + height + sex, data = _)
# Make plot here
```
## Your Turn 7
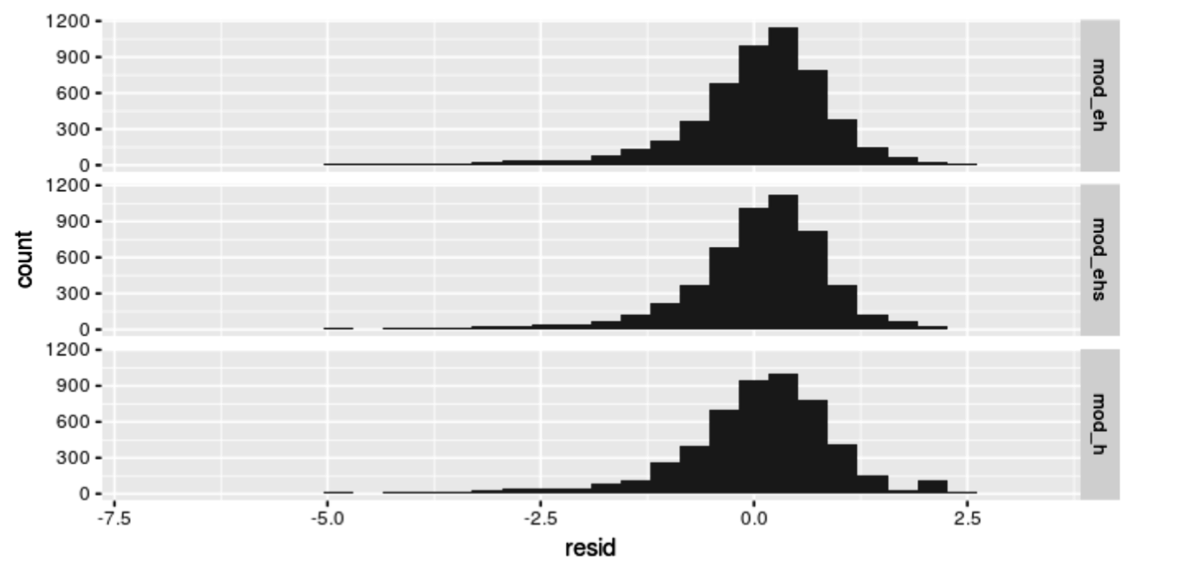
Use `gather_residuals()` to make the plot below.
::: {.callout-caution}
Models `mod_h` and `mod_ehs` should be available in your environment because you
fitted them in previous sections. But you have to fit and store the model
`mod_eh` which stands for `education` and `height`.
:::
```rgr
# Make the plot here
```
***
# Take Aways
* Use `glance()`, `tidy()`, and `augment()` from the **broom** package to return
model values in a data frame.
* Use `add_predictions()` or `gather_predictions()` or `spread_predictions()`
from the **modelr** package to visualize predictions.
* Use `add_residuals()` or `gather_residuals()` or `spread_residuals()` from the
**modelr** package to visualize residuals.