Principal Component Analysis
A. Stamm 
Overview
Dimensionality reduction
If you’ve worked with a lot of variables before, you know this can present problems. Do you understand the relationships between each variable? Do you have so many variables that you are in danger of overfitting your model to your data or that you might be violating assumptions of whichever modeling tactic you’re using?
You might ask the question, “How do I take all of the variables I’ve collected and focus on only a few of them?” In technical terms, you want to “reduce the dimension of your feature space.” By reducing the dimension of your feature space, you have fewer relationships between variables to consider and you are less likely to overfit your model.
Think about linear regression:
- multicollinearity issues;
- difficult to use strategies like backward elimination.
PCA
What ?
Principal component analysis is a technique for feature extraction: it combines our input variables in a specific way, so we can drop the “least important” ones while keeping the most valuable parts of all. As an added benefit, each of the “new” variables after PCA is independent of the others.
How ?
Dimension reduction identifies the principal directions, called principal components, in which the data varies. PCA assumes the directions with the largest variances are the most “important”.
When to use?
- Can’t identify variables to completely remove, but need fewer?
- Do you want your variables to be independent of one another?
- Are you comfortable with less interpretable variables?
Principle
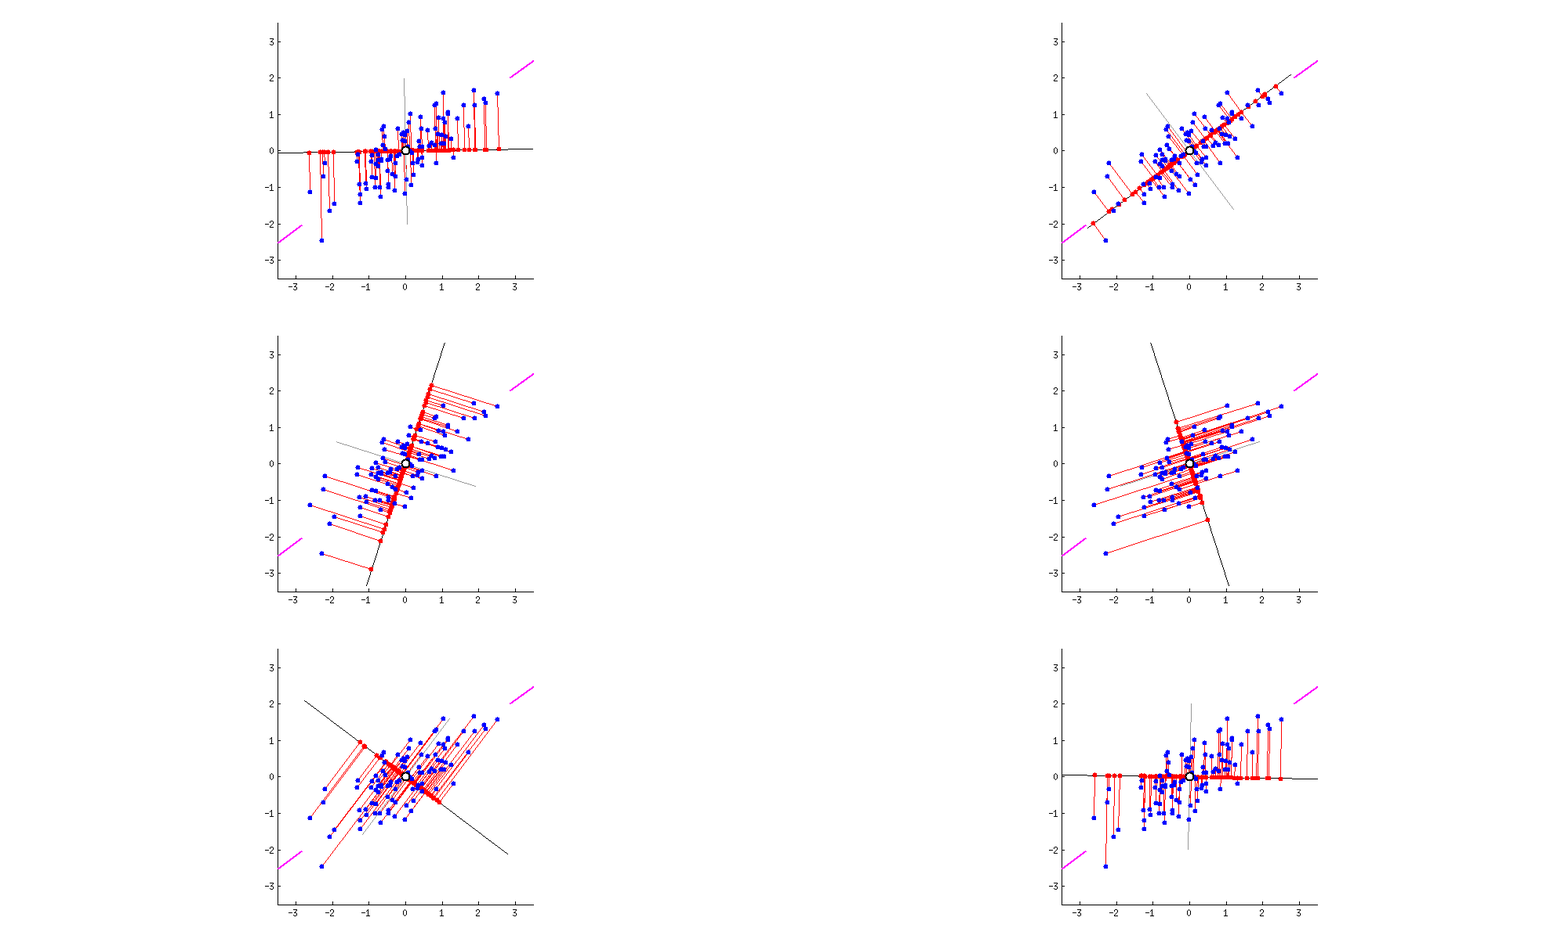
- The 1st principal component (PC) accounts for the largest possible variance in the data set;
- i.e. the line in which the projection of the points (red dots) is the most spread out.
- The second PC is uncorrelated to the 1st PC and maximizes the remaining variance;
- etc.
Mathematical formalism
Context.
\(\mathbf{X}_1, \dots, \mathbf{X}_n\) a sample of \(n\) i.i.d. random vectors in \(\mathbb{R}^p\); \(\mathbb{X}\) the \(n \times p\) data matrix; \(\Sigma\) the covariance of the \(\mathbf{X}_i\)’s.
Determination of the 1st PC
The 1st PC accounts for the largest possible variance in the data set.
- Search a linear projection \(\mathbf{a} \in \mathbb{R}^p\) of the original variables with maximal variance. Such projection reads \(\mathbb{X} \mathbf{a}\), of which each component has variance \(\mathrm{Var}( \left[ \mathbb{X} \mathbf{a} \right]_i) = \mathbf{a}^\top \Sigma \mathbf{a}\).
- A constraint is needed because the maximum does not exist in \(\mathbb{R}^p\): search for \(\| \mathbf{a} \| = 1\).
- Using the sample covariance \(S\), an unbiased estimator of \(\Sigma\), we maximize \(\max_{\mathbf{a} \in \mathcal{S}^{p-1}} \mathbf{a}^\top S \mathbf{a}\).
- Solution: an eigenvector of \(S\) for the largest eigenvalue; differentiating the Lagrangian gives \(S \mathbf{a} = \lambda \mathbf{a}\), so \(\lambda\) is the largest eigenvalue.
R Packages
Principal Component Computation
prcomp()andprincomp()from built-in R stats package,PCA()from FactoMineR package,dudi.pca()from ade4 package.
Recommendation
The FactoMineR::PCA() function.
Information Extraction and Visualization
The factoextra package.
Case Study
- Athletes’ performance during two sporting events (Decastar and OlympicG)
- It contains \(41\) individuals (athletes) described by \(13\) variables.
Objectives
PCA allows to describe a data set, to summarize a data set, to reduce the dimensionality. We want to perform a PCA on all the individuals of the data set to answer several questions:
Individuals’ study (athletes’ study)
Two athletes will be close to each other if their results to the events are close. We want to see the variability between the individuals.
- Are there similarities between individuals for all the variables?
- Can we establish different profiles of individuals?
- Can we oppose a group of individuals to another one?
Variables’ study (performances’ study)
We want to see if there are linear relationships between variables. The two objectives are to summarize the correlation matrix and to look for synthetic variables: can we resume the performance of an athlete by a small number of variables?
Link between this two studies
Can we characterize groups of individuals by variables?
PCA Terminology
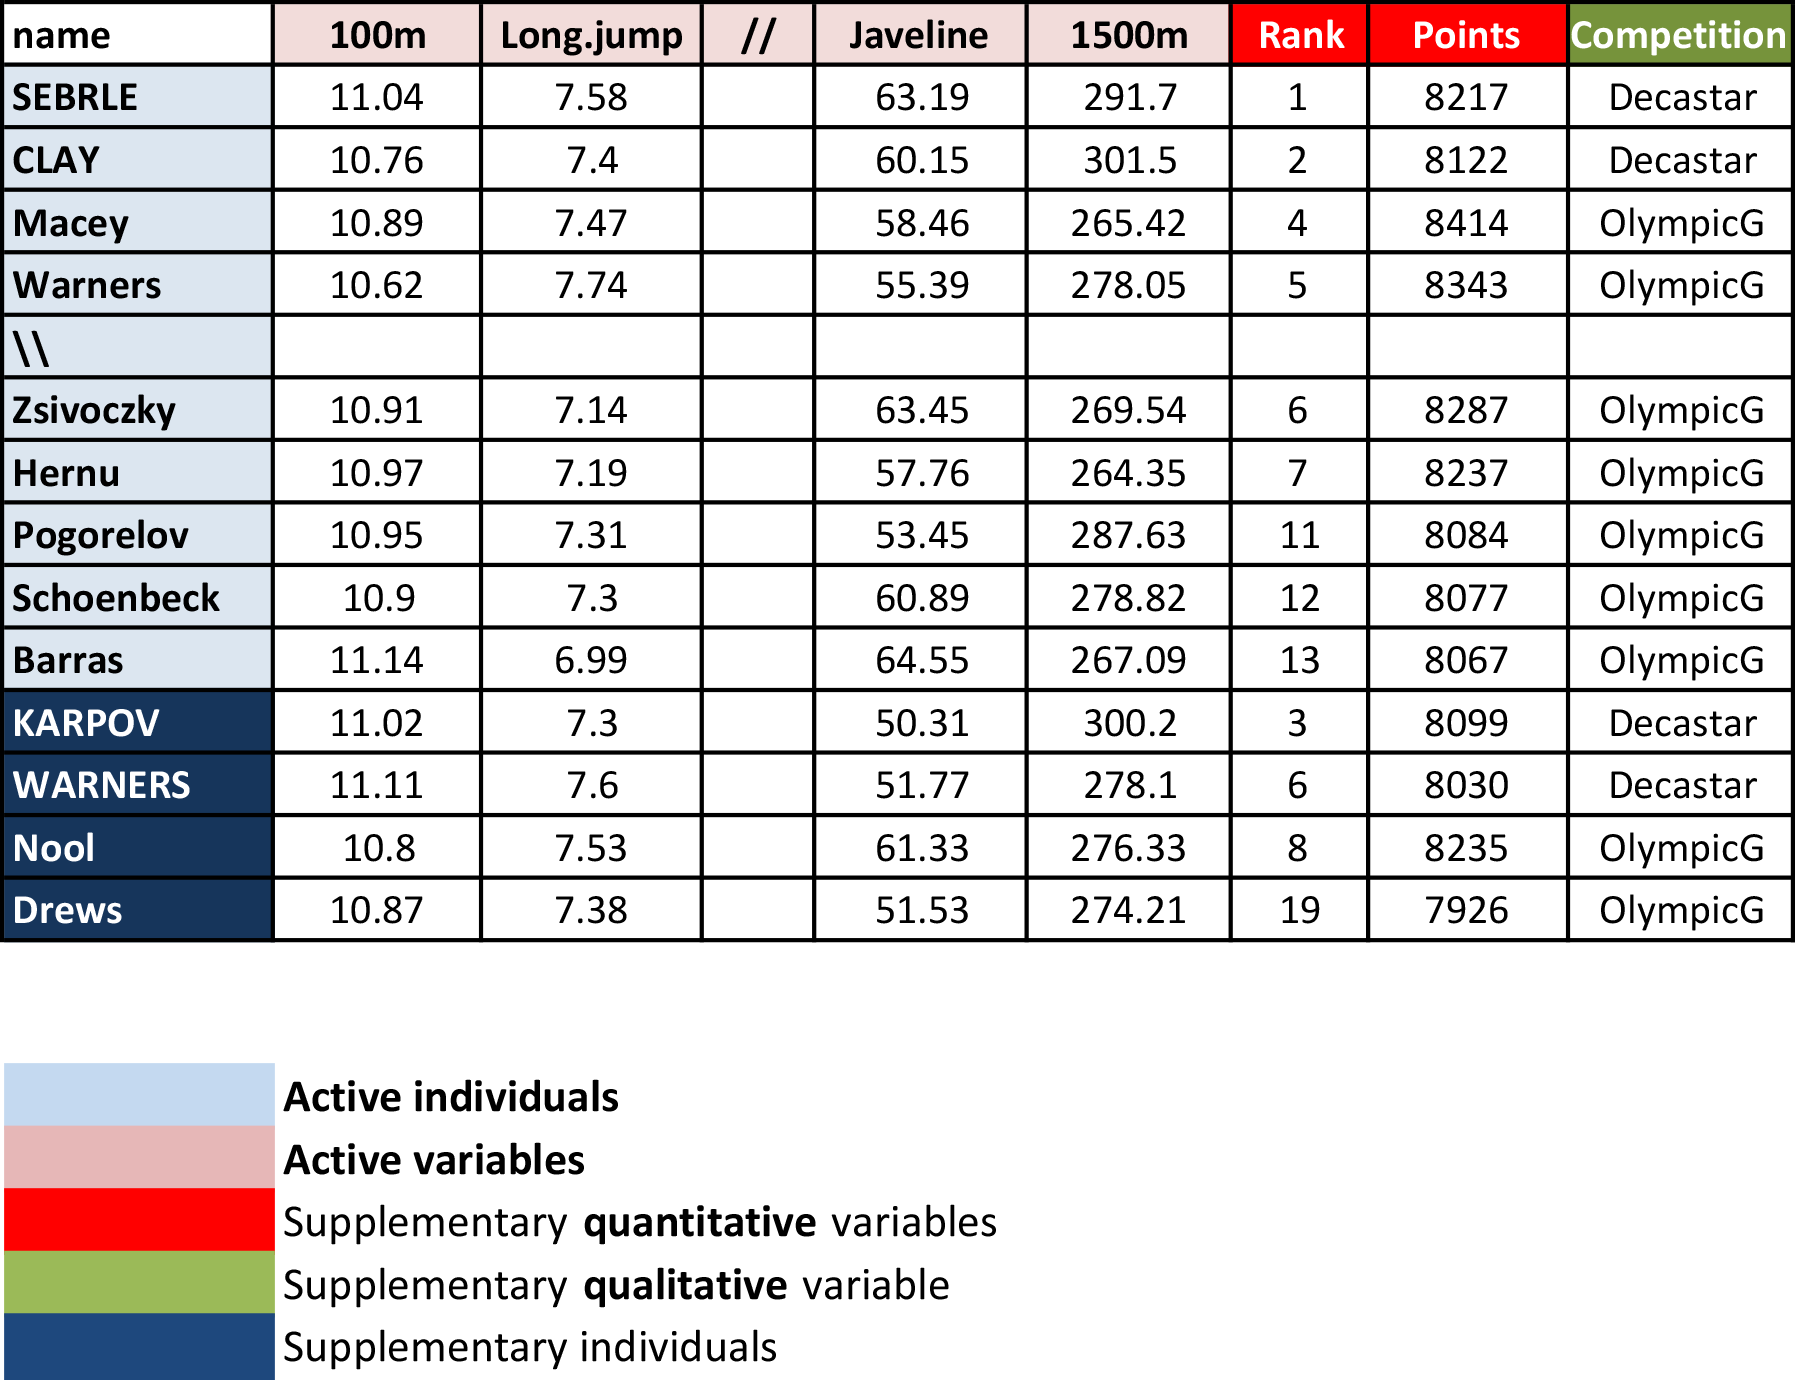
Active individuals: the individuals used for PCA; supplementary individuals: coordinates predicted from the active PCA parameters.
Active variables: the variables used for PCA; supplementary variables: coordinates predicted as well. Either:
- Continuous (cols 11, 12): rank and points of athletes.
- Qualitative (col 13): the athletic meeting (2004 Olympic Game or Decastar), used to color individuals by groups.
Data standardization
Description of the problem
PCA linearly combines original variables to maximize variance
If one variable is measured in meter and another in centimeter, the first one will contribute more to the variance than the second one, even if the intrinsic variability of each variable is the same.
\(\Longrightarrow\) We need to scale the variables prior to performing PCA!
A common solution: Standardization
\[ x_{ij} \leftarrow \frac{x_{ij} - \overline{x}_j}{\sqrt{\frac{1}{n-1} \sum_{\ell=1}^n (x_{\ell j} - \overline{x}_j)^2}} \]
\(\Longrightarrow\) The function PCA() in FactoMineR, standardizes the data automatically.
PCA() Syntax
PCA(
  # a data frame with n rows (individuals) and p columns (numeric variables)
  X = ,

  # number of dimensions kept in the results (by default 5)
  ncp = ,

  # a vector indicating the indexes of the supplementary individuals
  ind.sup = ,

  # a vector indicating the indexes of the quantitative supplementary variables
  quanti.sup = ,

  # a vector indicating the indexes of the categorical supplementary variables
  quali.sup = ,

  # boolean, if TRUE (default) a graph is displayed
  graph =
)
Running PCA()
PCA(X = decathlon[, 1:10], graph = FALSE)**Results for the Principal Component Analysis (PCA)**
The analysis was performed on 41 individuals, described by 10 variables
*The results are available in the following objects:
name description
1 "$eig" "eigenvalues"
2 "$var" "results for the variables"
3 "$var$coord" "coord. for the variables"
4 "$var$cor" "correlations variables - dimensions"
5 "$var$cos2" "cos2 for the variables"
6 "$var$contrib" "contributions of the variables"
7 "$ind" "results for the individuals"
8 "$ind$coord" "coord. for the individuals"
9 "$ind$cos2" "cos2 for the individuals"
10 "$ind$contrib" "contributions of the individuals"
11 "$call" "summary statistics"
12 "$call$centre" "mean of the variables"
13 "$call$ecart.type" "standard error of the variables"
14 "$call$row.w" "weights for the individuals"
15 "$call$col.w" "weights for the variables" Visualization and Interpretation
The factoextra package
It helps interpret PCA. Whatever function you use (stats::prcomp(), FactoMiner::PCA(), ade4::dudi.pca(), ExPosition::epPCA()), factoextra makes it easy to extract and visualize the results.
Useful extraction and visualization functions
get_eigenvalue(): Extract the eigenvalues/variances of principal components.fviz_screeplot(): Visualize the eigenvalues / proportion of explained variance.get_pca_ind(),get_pca_var(): Extract the results for individuals and variables, respectively.fviz_pca_ind(),fviz_pca_var(): Visualize the results individuals and variables, respectively.fviz_pca_biplot(): Make a biplot of individuals and variables.
Choice of the reduced dimension
Eigenvalues / Variances
Eigenvalues measure the amount of variation retained by each principal component.
eig_val <- get_eigenvalue(res_pca)
html_table(eig_val)
Choosing the appropriate number of PCs
Eigenvalues can be used to determine the number of principal components to retain.
Guidelines.
- An eigenvalue > 1 means a PC accounts for more variance than one of the original standardized variables; a common cutoff (only when the data are standardized).
- Balance a small number of PCs (good dimensionality reduction) against the proportion of total variance explained.
- Look at the first few PCs for interesting patterns.
Graphical tool.
Warning: This FactoMineR PCA result contains only 5 eigenvalues and does not
include the complete spectrum. Refit the PCA with a larger `ncp` before drawing
a complete scree plot.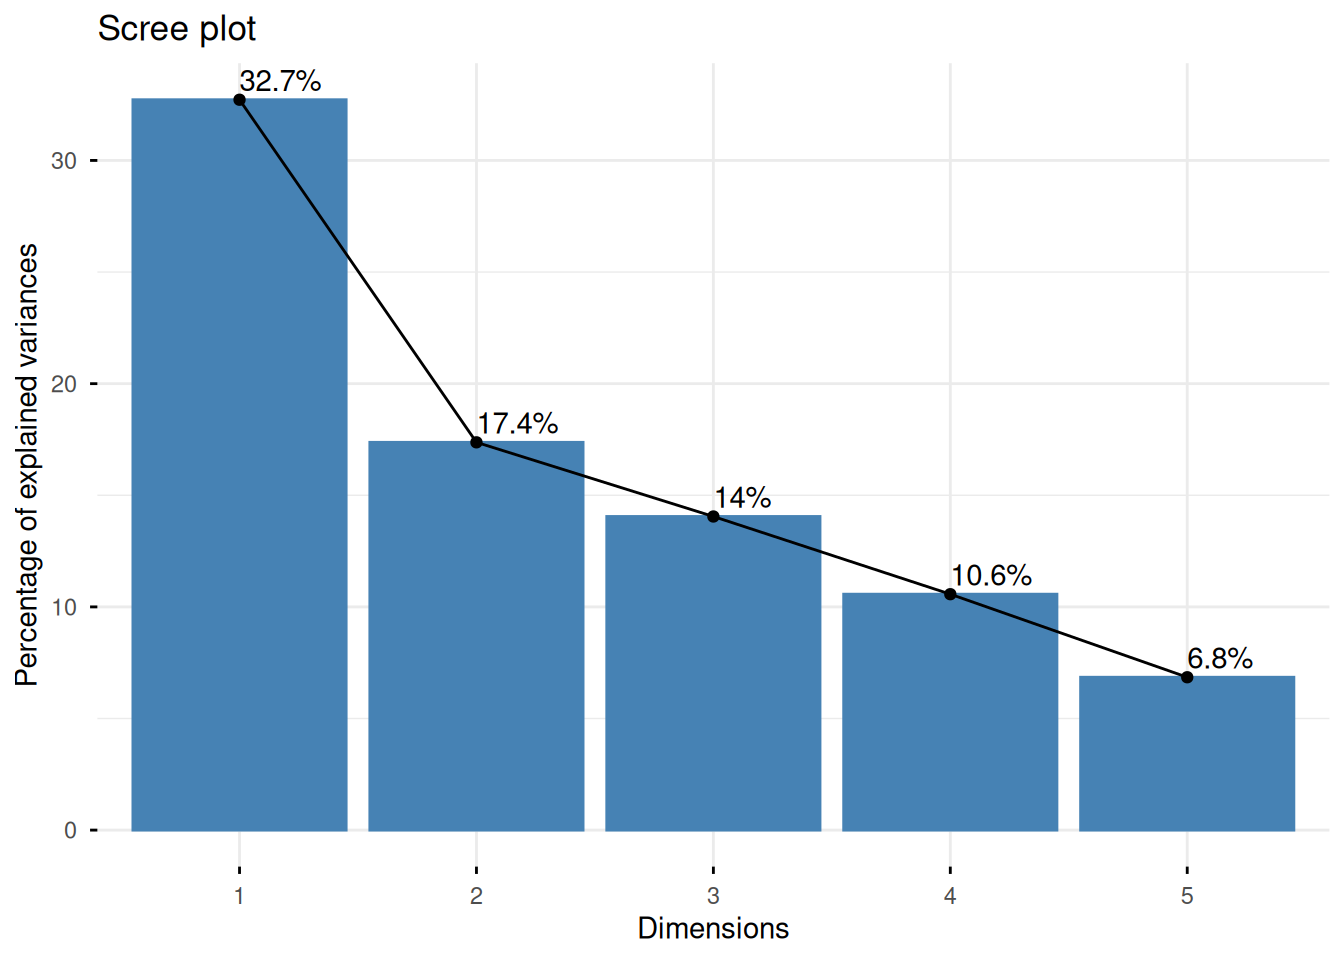
fviz_screeplot(res_pca, addlabels = TRUE)Analysis of the variables
Variable Information in PCA
Variable information extraction
var_info <- get_pca_var(res_pca)Components
var_info$coord: Coordinates for the variables.var_info$cos2: Quality of representation of variables by PC:var.cos2 = var.coord * var.coord.var_info$contrib: Contributions of the variables to the principal components:(var.cos2 * 100) / (sum cos2 of the component).
Usage
- Investigate the ability of PCs to strongly represent variables.
- Describe each PC in terms of the most contributing variables.
$coord: Correlation variables & components
Property: norms of column vectors is 1 (eigenvectors).
Consequence: each coordinate is in [-1,1].
Contribution of PCs to variables
fviz_pca_var(): Correlation circle
fviz_pca_var(res_pca, col.var = "black")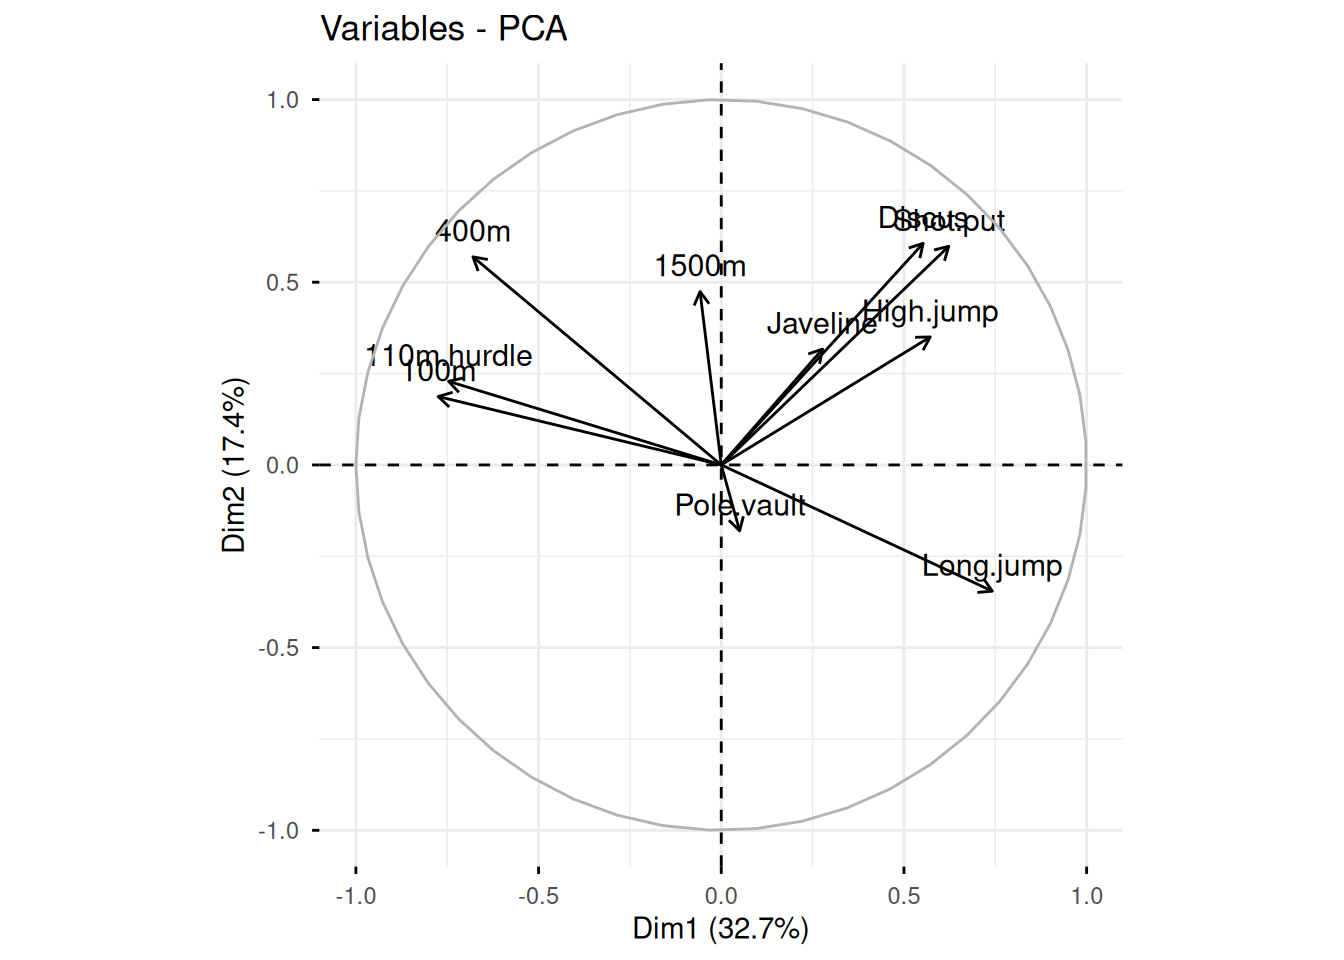
$cos2: Quality of representation
Positive and negative strong correlations of PCs to a given variable imply that the PCs represent it well.
Squared correlations thus measure quality of representation.
$cos2: Graphical tool 1
corrplot::corrplot(var_info$cos2, is.corr = FALSE)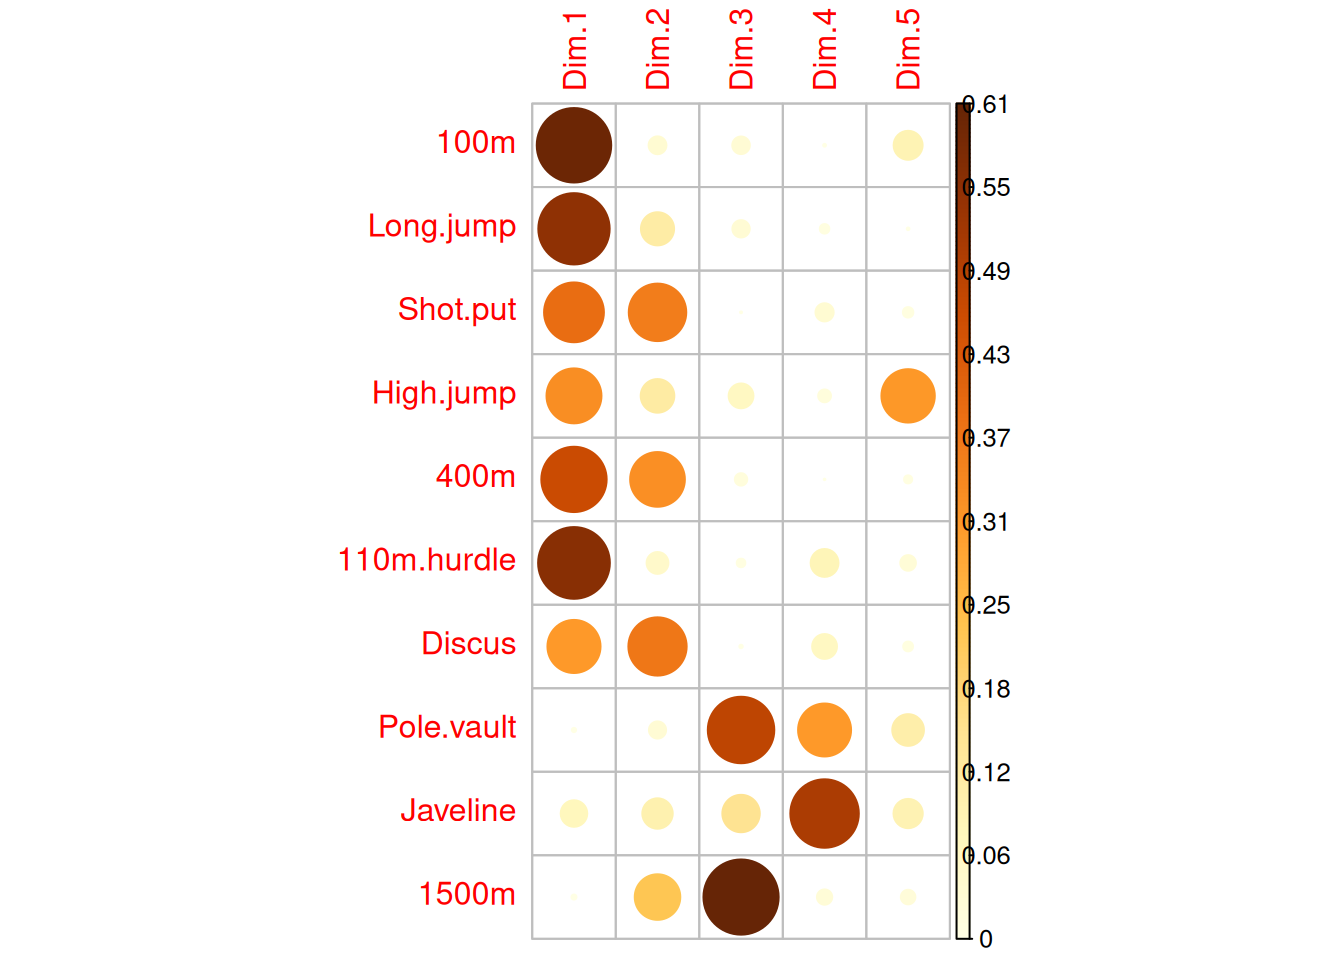
$cos2: Graphical tool 2
# Total cos2 of variables on Dim.1 and Dim.2
factoextra::fviz_cos2(res_pca, choice = "var", axes = 1:2)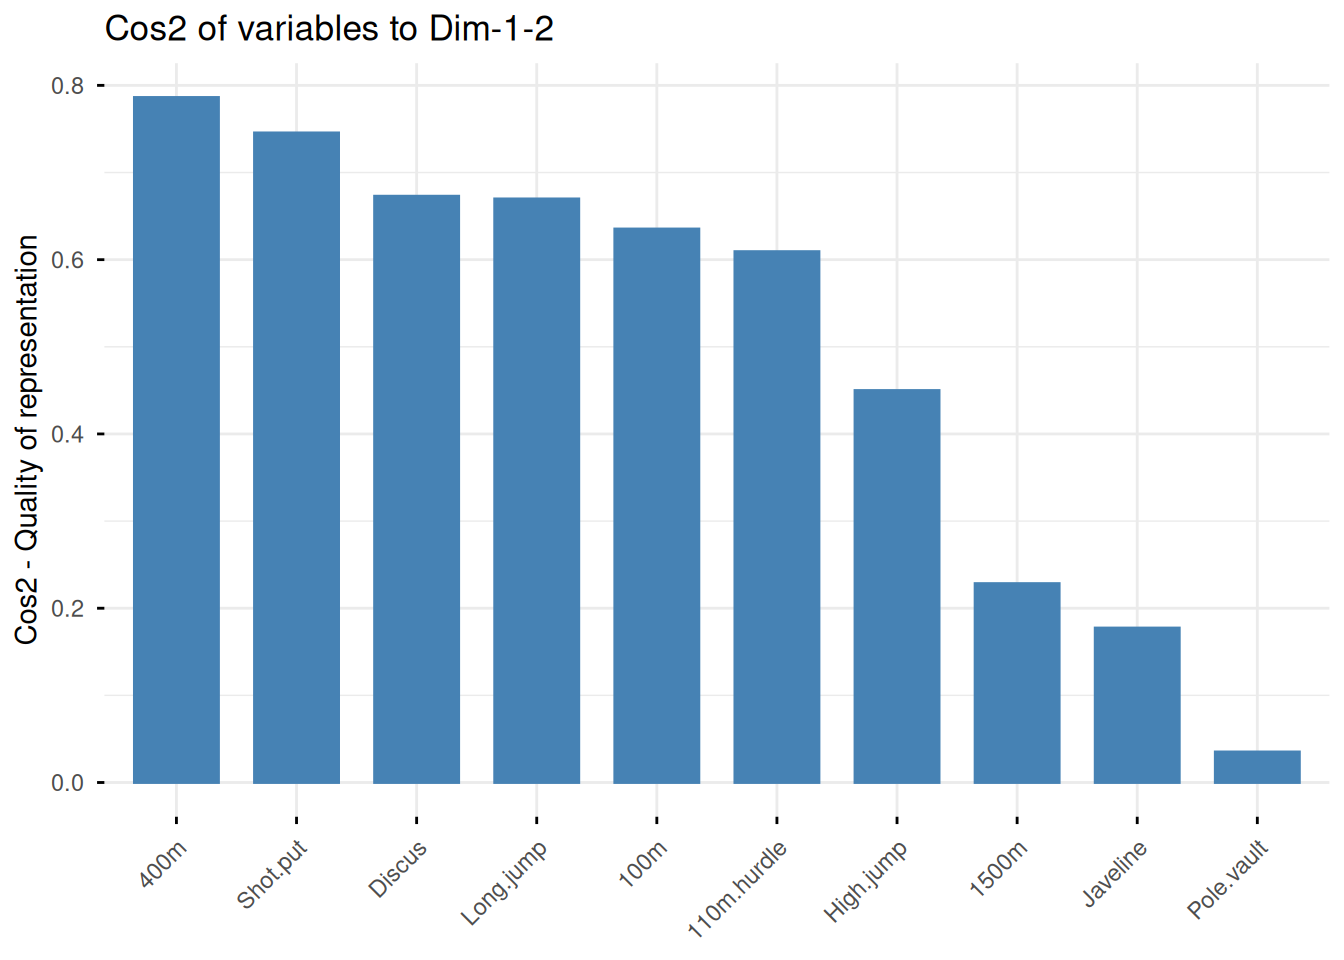
$cos2: Summary
- The
cos2values estimate the quality of the representation. - High
cos2means the variable is well represented by the corresponding PC. - Low
cos2means it is poorly represented. - Variables close to the circle in the plot are very well represented by the 1st two PCs.
- Variables close to the center are not well represented.
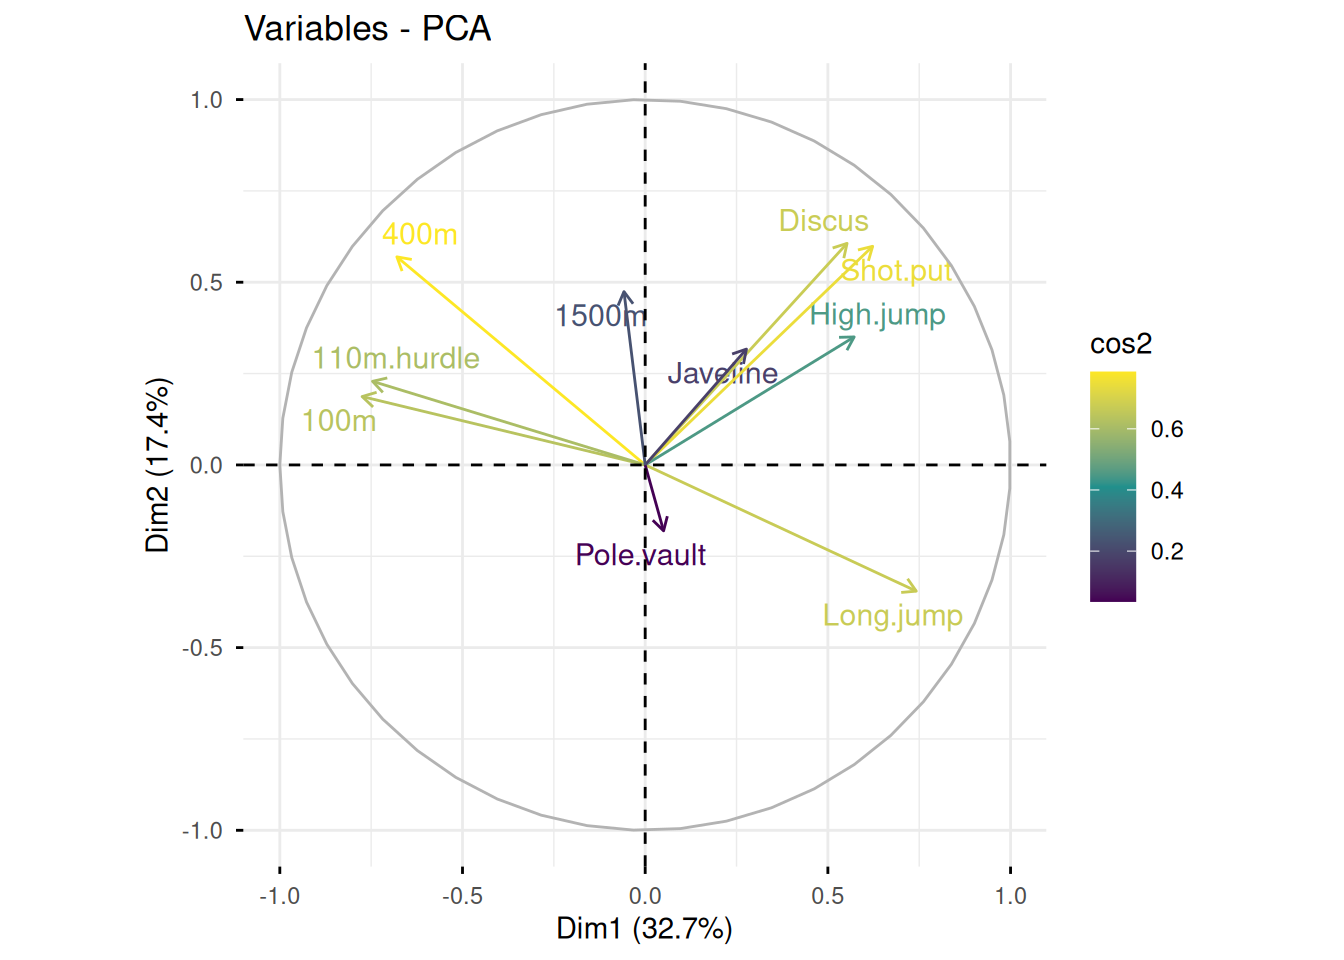
fviz_pca_var(X = res_pca, col.var = "cos2", gradient.cols = viridis(3), repel = TRUE)Contribution of variables to PCs
$contrib: Important variables
- Most important: variables correlating with
Dim.1andDim.2. - Variables correlating with no PC (or only the last ones) can be removed.
$contrib: Graphical tool 1
corrplot::corrplot(var_info$contrib, is.corr = FALSE)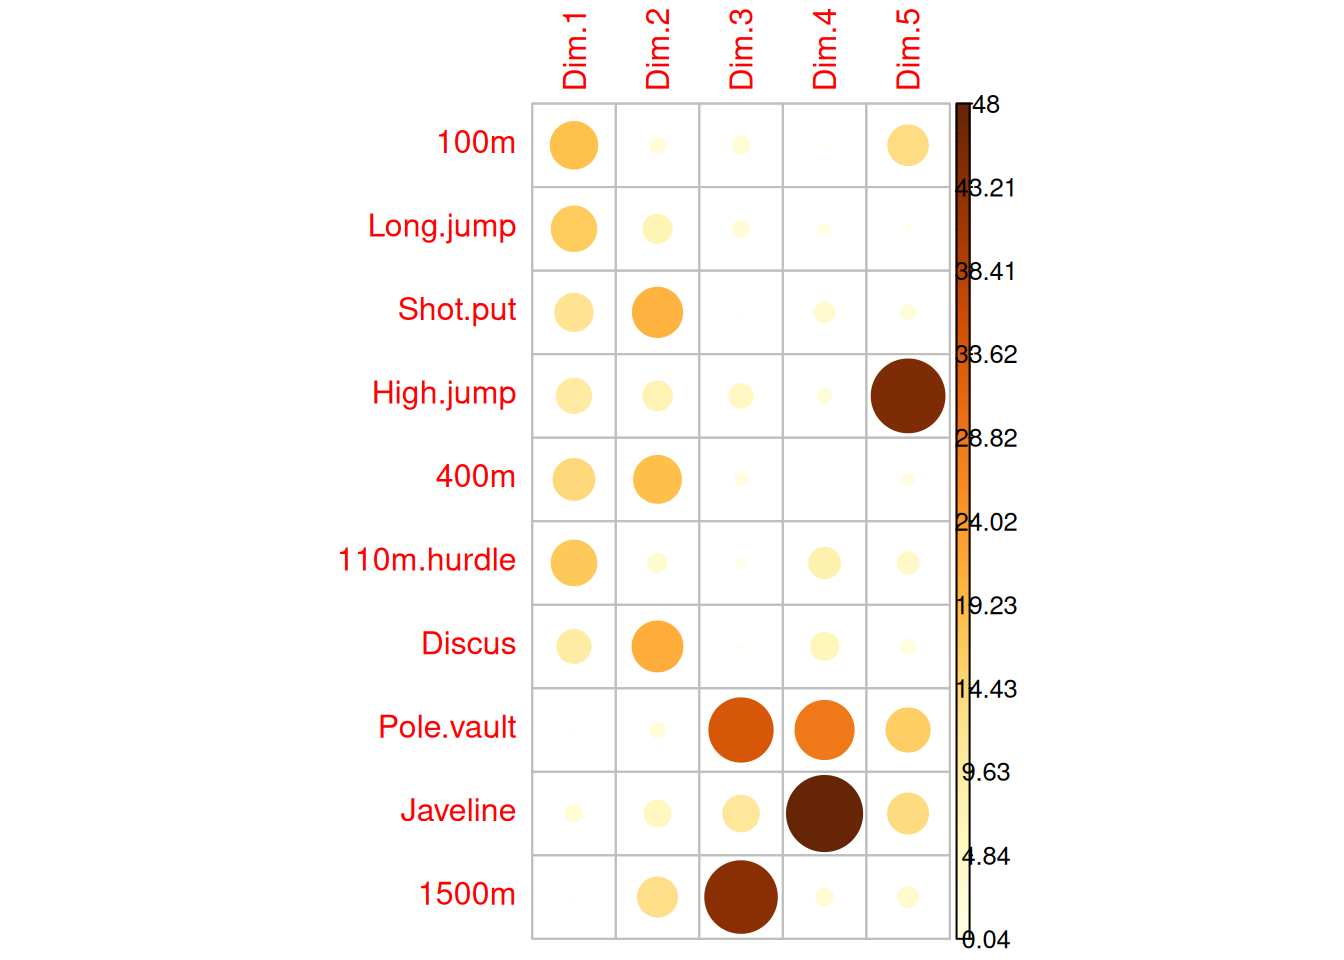
$contrib: Graphical tool 2
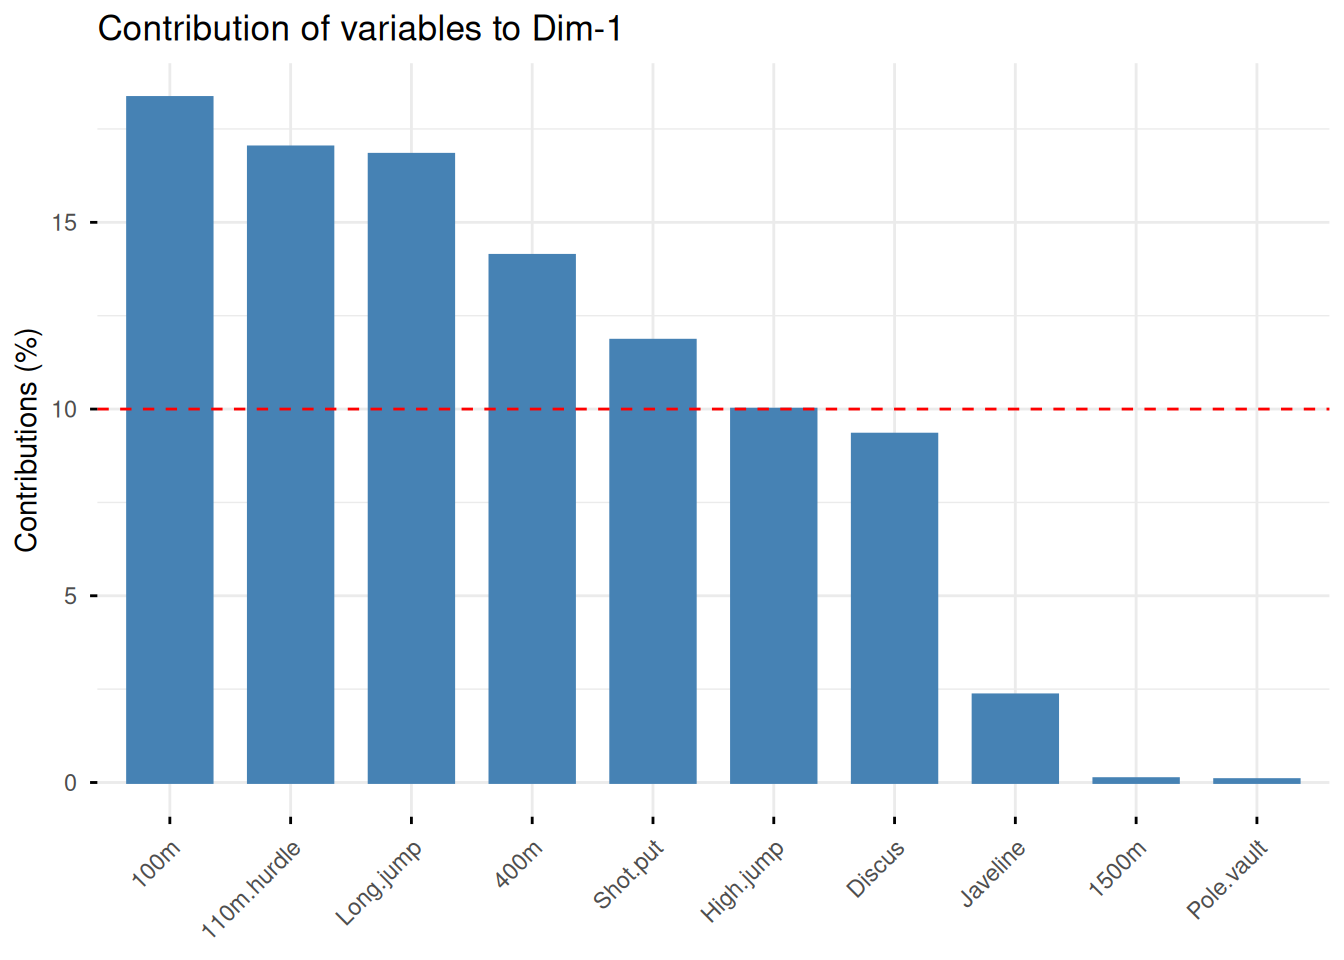
# Contributions of variables to PC1
factoextra::fviz_contrib(
  X = res_pca,
  choice = "var",
  axes = 1,
  top = 10
)
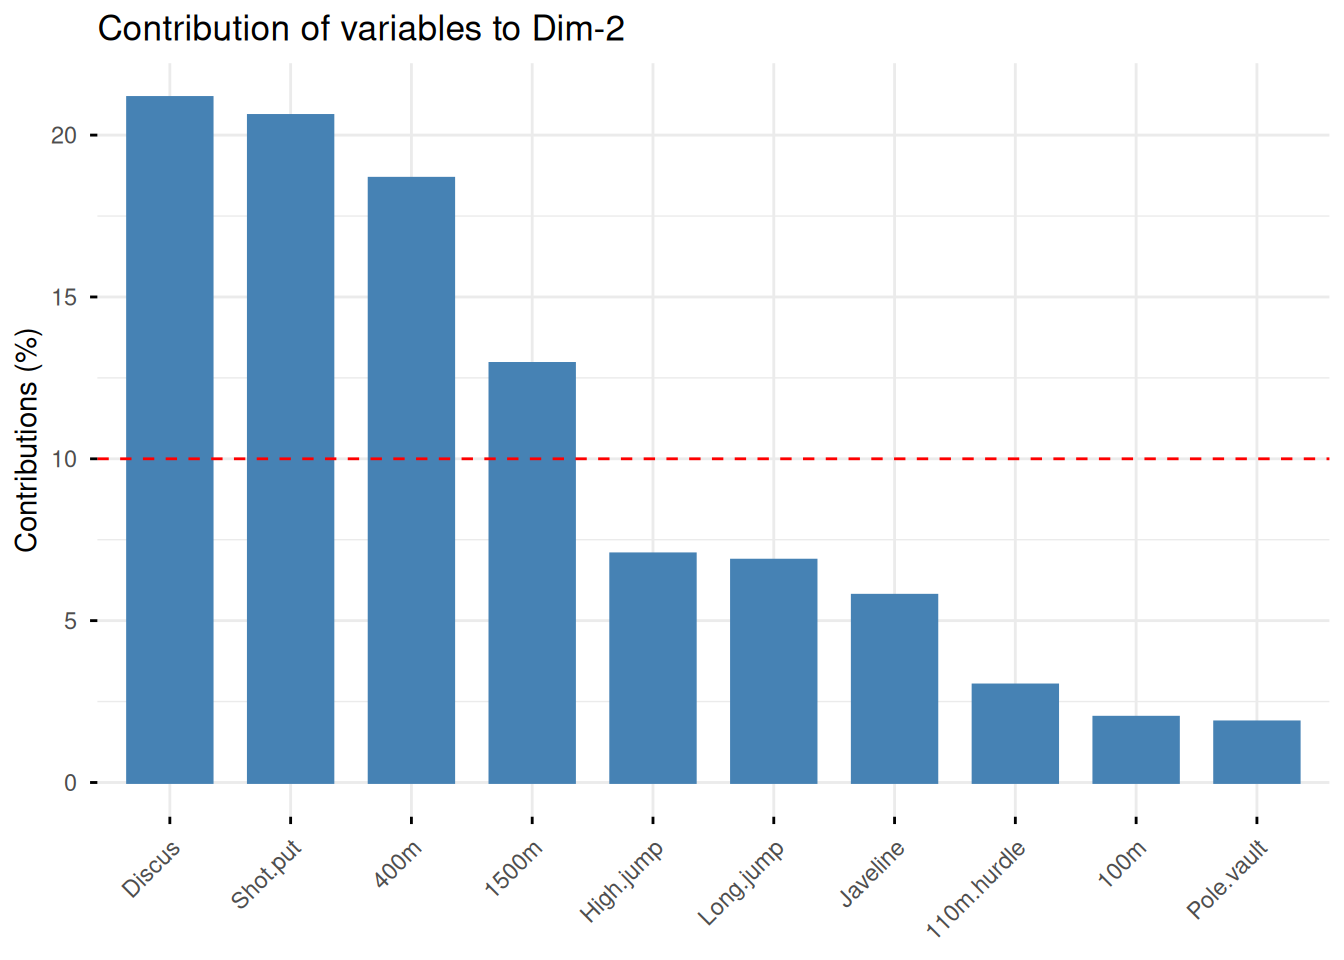
# Contributions of variables to PC2
factoextra::fviz_contrib(
  X = res_pca,
  choice = "var",
  axes = 2,
  top = 10
)
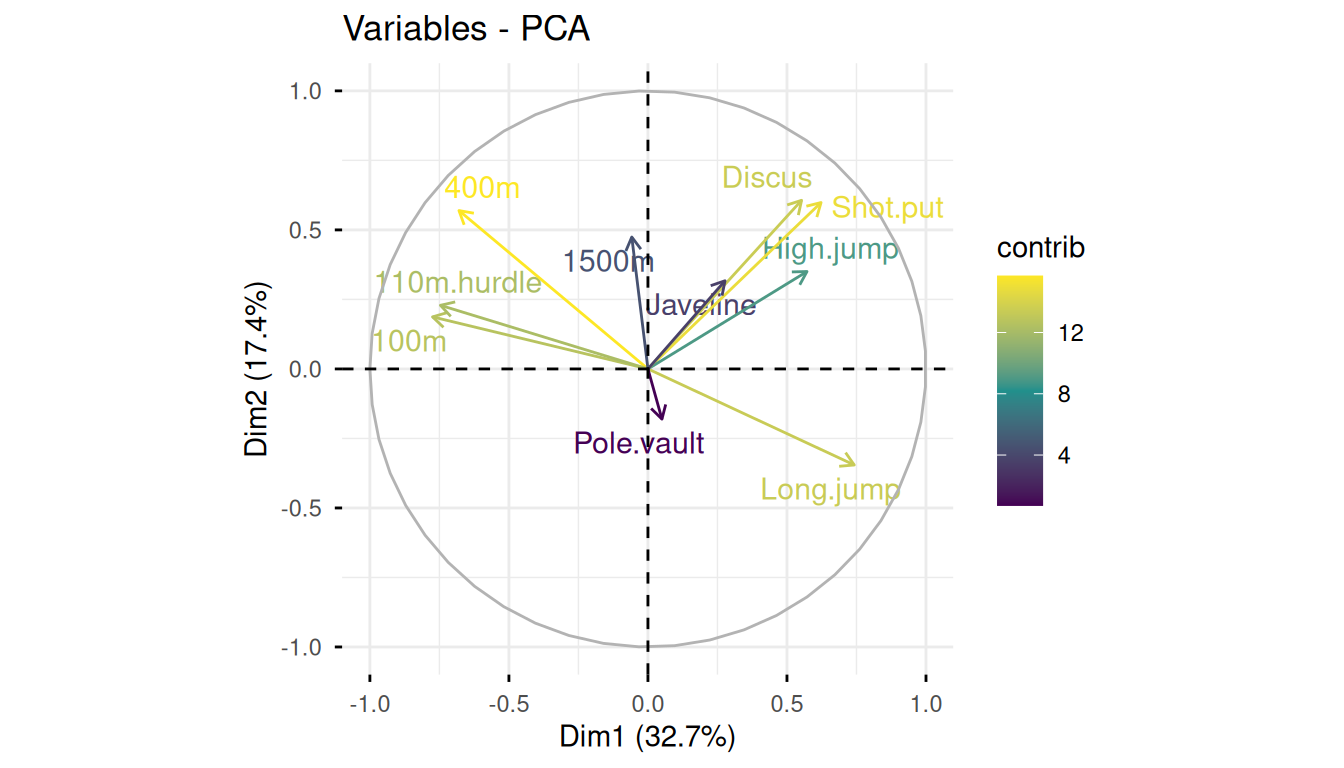
$contrib: Summary
factoextra::fviz_pca_var(
  X = res_pca,
  col.var = "contrib",
  gradient.cols = viridis::viridis(3),
  repel = TRUE
)
Component description
res_pca_var_desc <- FactoMineR::dimdesc(res = res_pca, axes = c(1, 2), proba = 0.05)Description of PC1
Description of PC2
Analysis of the individuals
The reduced space
Individual information extraction
ind_info <- get_pca_ind(res_pca)Components
ind_info$coord: Coordinates of the individuals.ind_info$cos2: Quality of representation of individuals by PC:ind.cos2 = ind.coord * ind.coord.ind_info$contrib: Contributions of the individuals to the principal components:(ind.cos2 * 100) / (sum cos2 of the component).
Usage
- The reduced space should allow easier identification of patterns, provided that it represents them well.
- Individuals that are similar are grouped together on the plot.
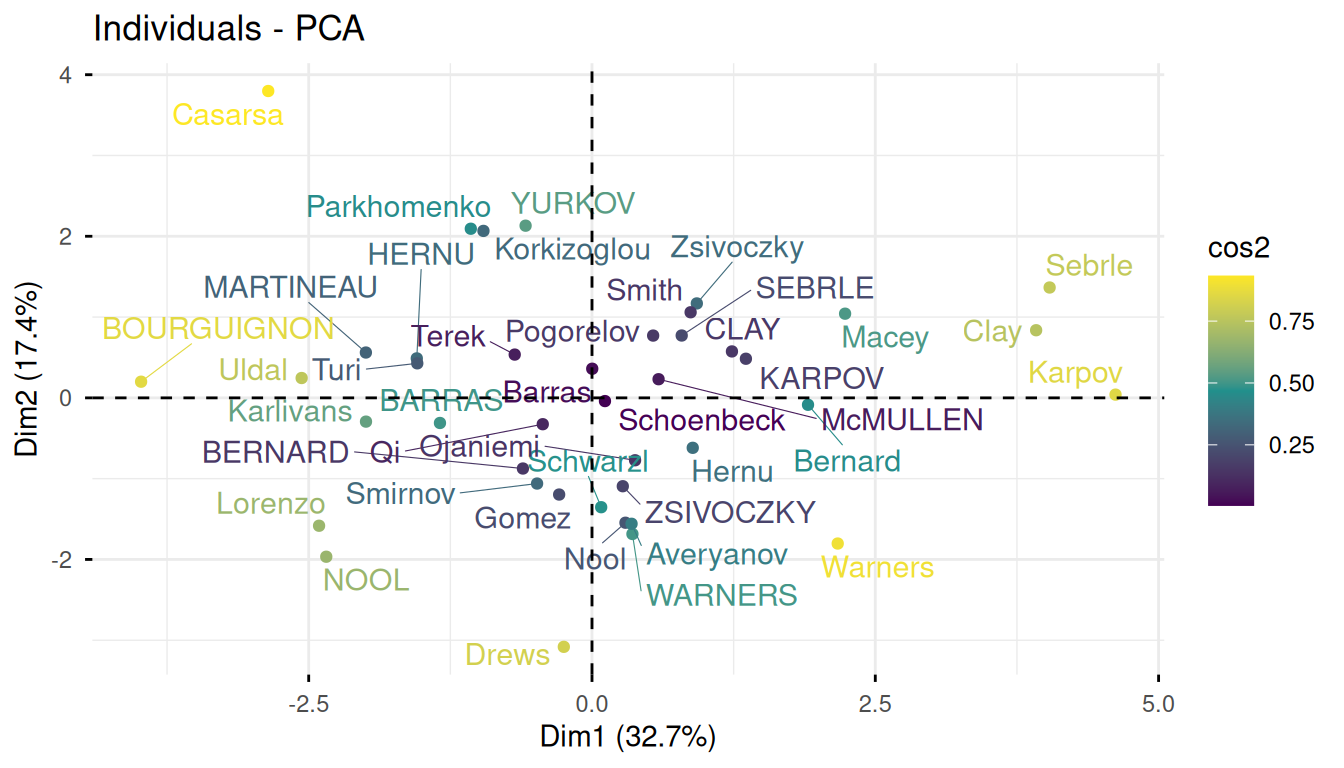
First factorial plane & quality
factoextra::fviz_pca_ind(
  X = res_pca,
  col.ind = "cos2",
  gradient.cols = viridis::viridis(3),
  repel = TRUE # Avoid text overlapping (slow if many points)
)
First factorial plane & contribution
# Total contribution on PC1 and PC2
factoextra::fviz_contrib(res_pca, choice = "ind", axes = 1:2)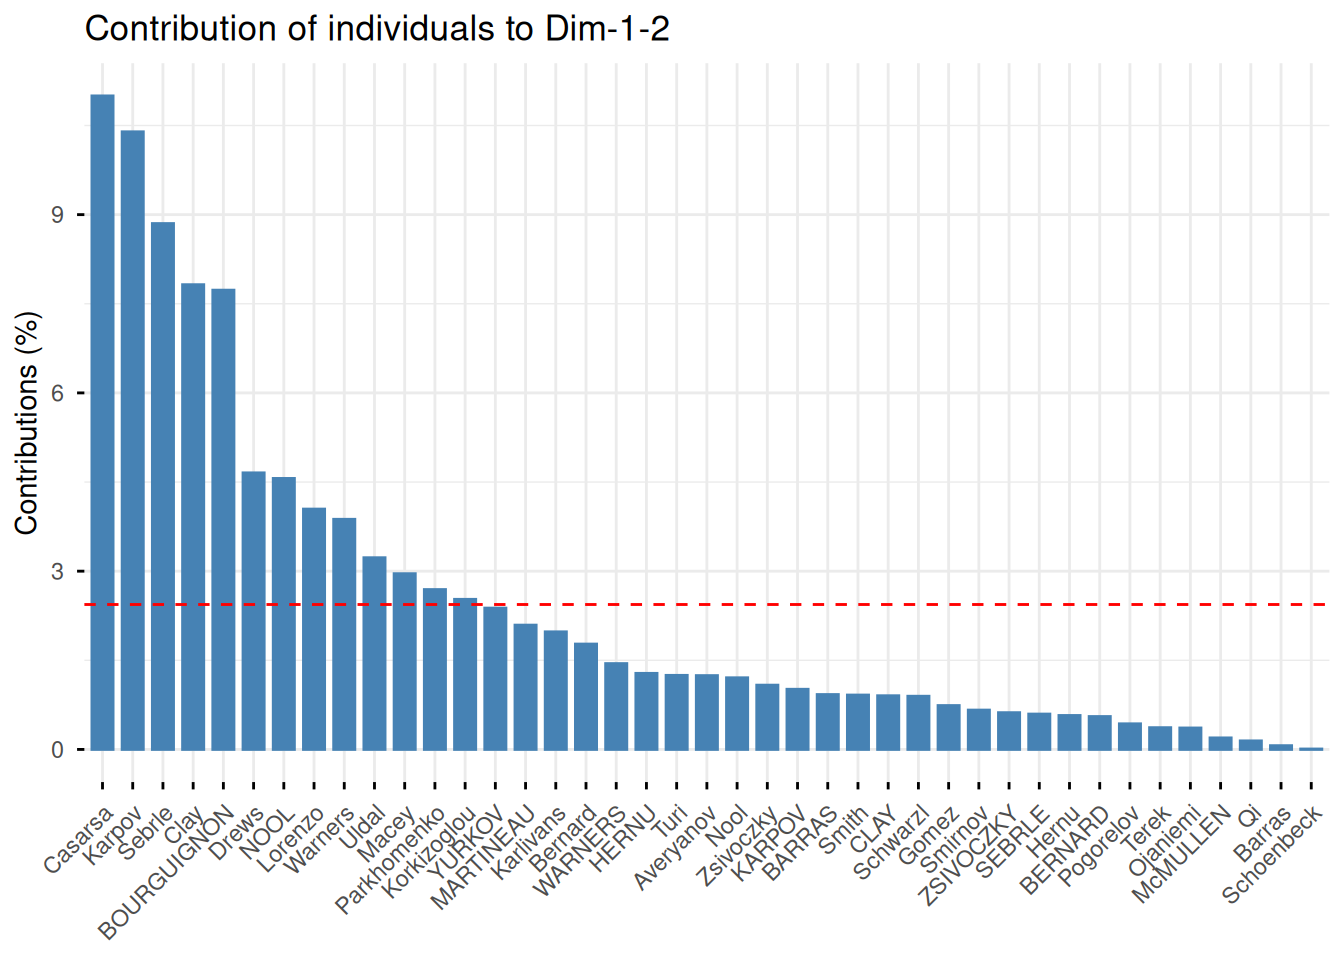
First factorial plane colored by groups
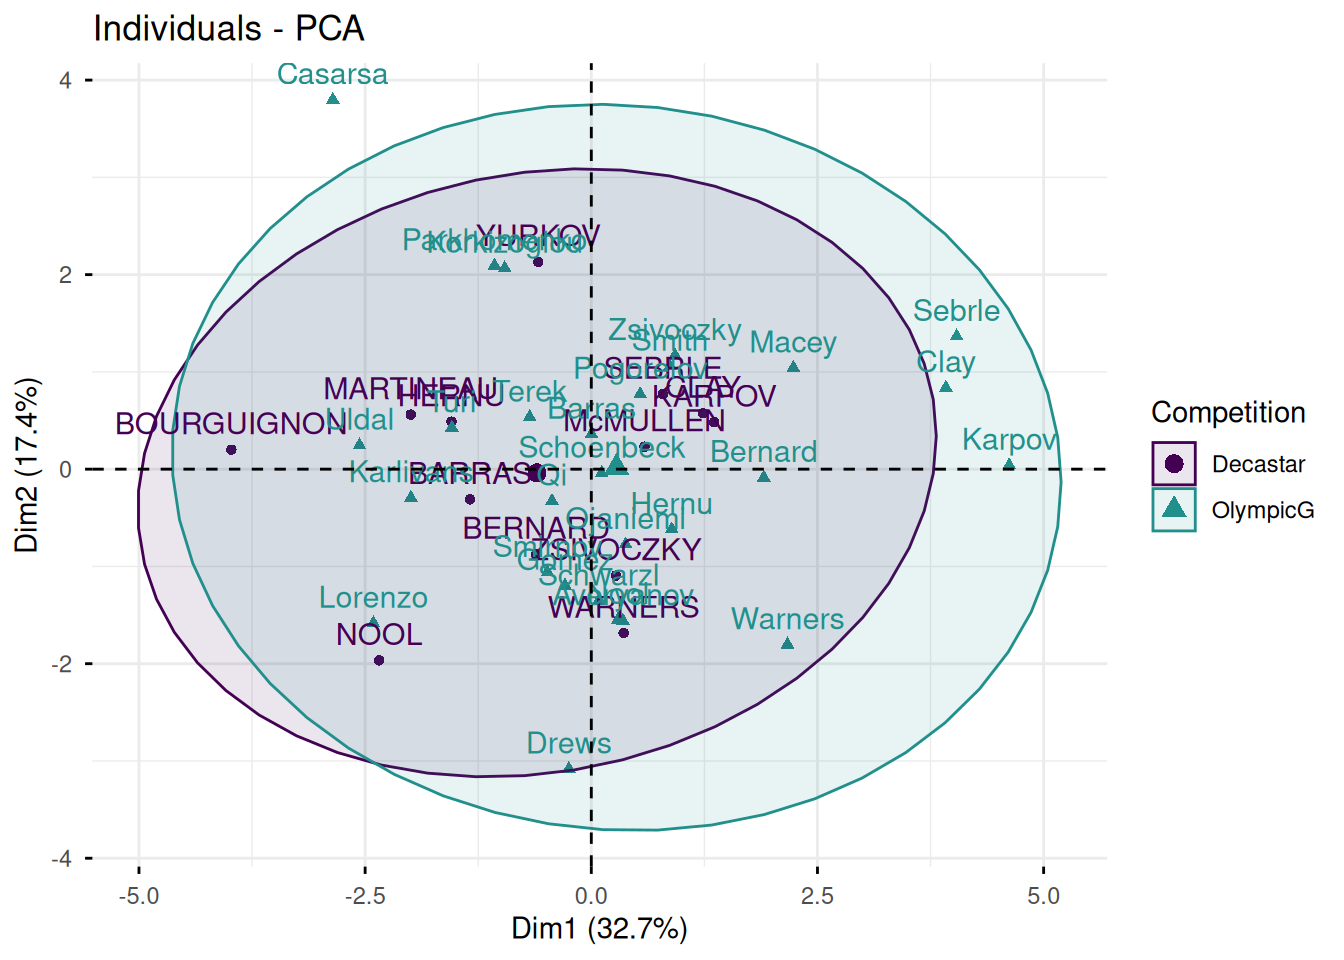
factoextra::fviz_pca_ind(
  X = res_pca,
  col.ind = decathlon$competition[1:23], # color by groups
  palette = viridis::viridis(3),
  addEllipses = TRUE, # Concentration ellipses
  legend.title = "Competition"
)- This plot shows the ability of a factorial plane to discriminate individuals based on a feature.
- Here, athletes at the Olympics tend to score positively on PC1, Decastar athletes negatively.
- But the ellipses seem to overlap significantly.
Combined variable and individual analysis
Biplot
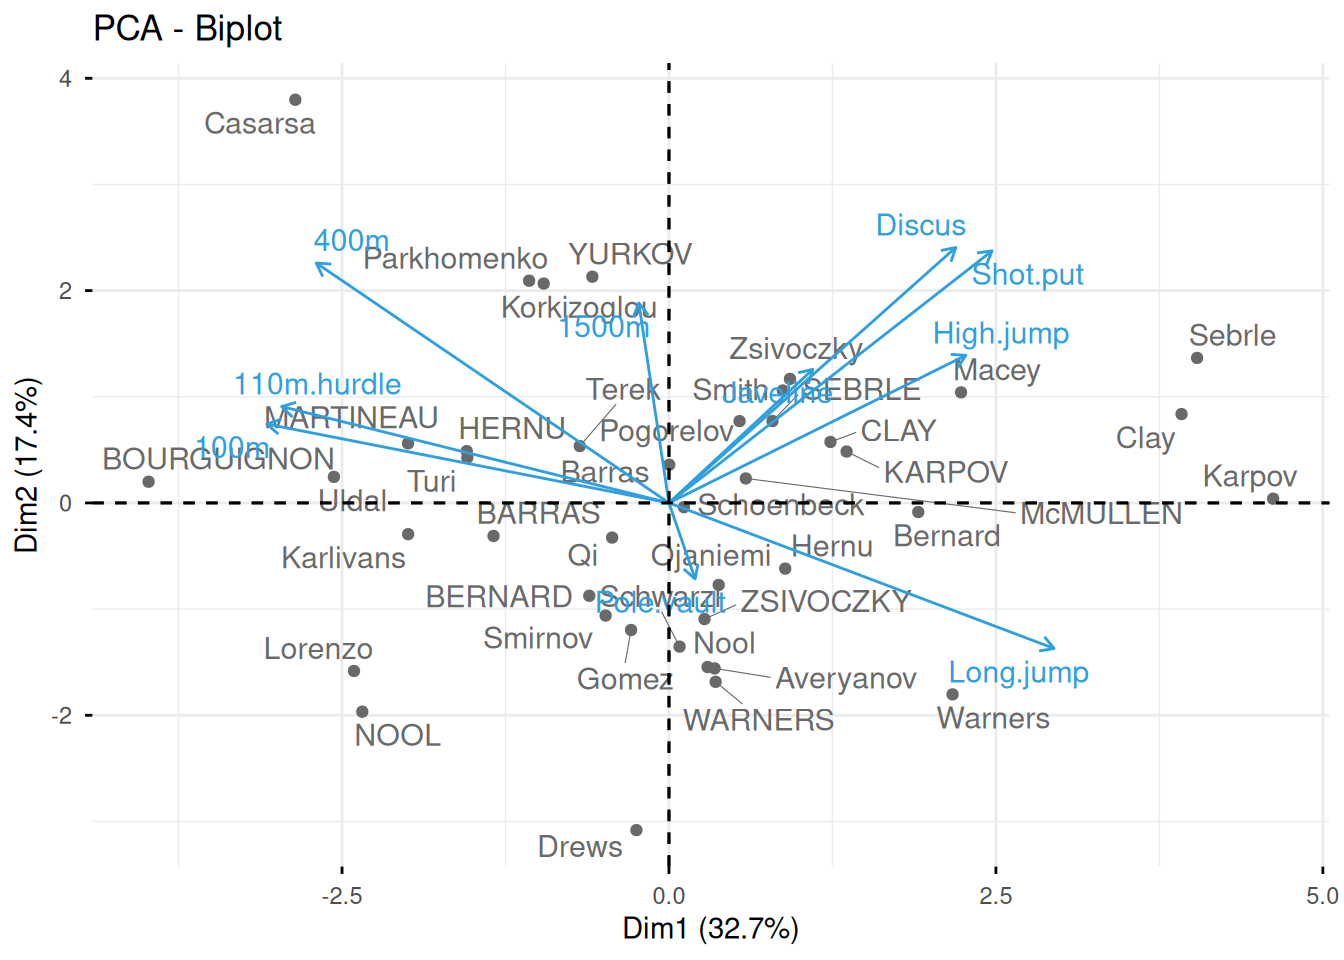
fviz_pca_biplot(res_pca, repel = TRUE,
col.var = "#2E9FDF", col.ind = "#696969")- Only useful with few variables and individuals; otherwise unreadable.
- Coordinates of individuals and variables are not on the same space: focus on the variable directions, not their absolute positions.
- An individual on the same side of a variable has a high value for that variable; on the opposite side, a low value.
Interpretation
- The first two dimensions resume 50% of the total inertia (i.e. the total variance of the data set).
100mis correlated negatively tolong.jump: a short100mtime goes with a big jump. Be careful: a low value for100m,400m,110m.hurdleand1500mmeans a high score (a shorter time scores more points).- The first axis opposes athletes who are good everywhere (Karpov, Olympic Games) to those who are bad everywhere (Bourguignon, Decastar). This dimension is linked to the speed and long jump variables, which form a homogeneous group.
- The second axis opposes athletes who are strong (
Discus,Shot.put) to those who are weak. Discus,Shot.putandHigh.jumpare not much correlated to100m,400m,110m.hurdleandLong.jump: strength is not much correlated to speed.
At this point, we can divide the first factorial plane into four parts: fast and strong athletes (like Sebrle), slow athletes (like Casarsa), fast but weak athletes (like Warners) and slow and weak athletes (like Lorenzo).
Your turn
- Download the lab file and related data sets from the course website in a folder on your computer.
- Open the file
12-PCA-Exercises.qmdand perform the PCA analyses for the proposed data sets.
References
- https://towardsdatascience.com/a-one-stop-shop-for-principal-component-analysis-5582fb7e0a9c
- http://www.sthda.com/english/articles/31-principal-component-methods-in-r-practical-guide/112-pca-principal-component-analysis-essentials/
- https://builtin.com/data-science/step-step-explanation-principal-component-analysis
- https://royalsocietypublishing.org/doi/pdf/10.1098/rsta.2015.0202
- http://www.sthda.com/english/articles/31-principal-component-methods-in-r-practical-guide/112-pca-principal-component-analysis-essentials/
- http://factominer.free.fr/factomethods/principal-components-analysis.html