# A tiny placeholder plot so the book renders before you add your own analysis.
ggplot(data.frame(x = rnorm(200), y = rnorm(200)), aes(x, y)) +
  geom_point(alpha = 0.4, colour = "#2E7D6B") +
  labs(x = "your variable", y = "your other variable")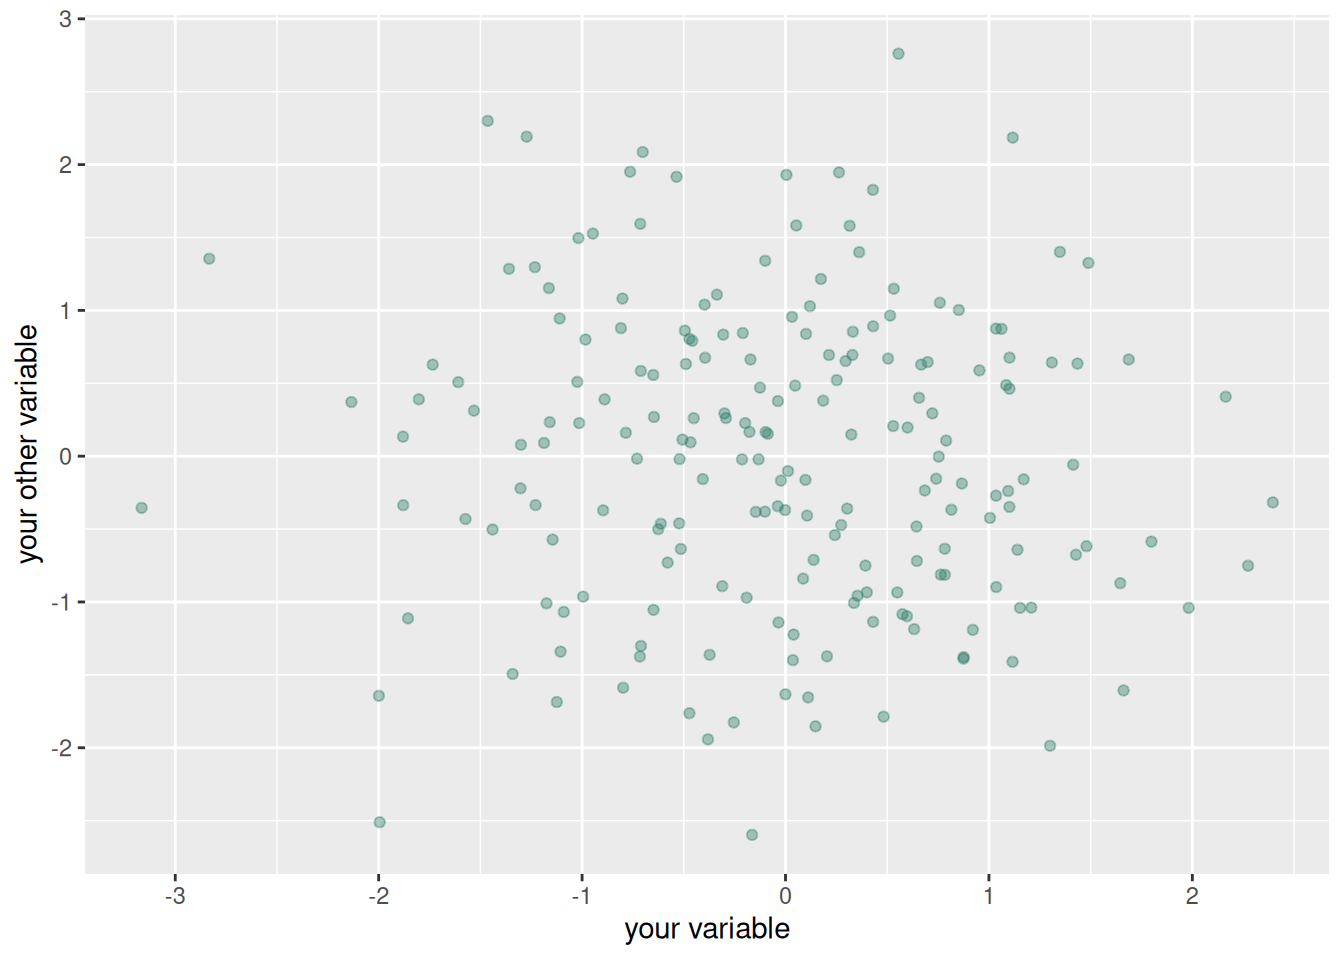
This is your data science portfolio. Over the semester it will grow from a single exploratory data analysis (EDA) project into a collection of reproducible analyses, each versioned with git, with dependencies pinned via renv/uv, and published to a URL on Posit Connect.
The chapters in this book are:
{pins}.This folder is a starter book: copy it into your own workspace and make it yours. See README.md for the full walkthrough.
# A tiny placeholder plot so the book renders before you add your own analysis.
ggplot(data.frame(x = rnorm(200), y = rnorm(200)), aes(x, y)) +
geom_point(alpha = 0.4, colour = "#2E7D6B") +
labs(x = "your variable", y = "your other variable")The book is language-agnostic: Chapter 1 uses R, but later chapters could just as easily use Python. What makes it reproducible is the pipeline around it: data sourced reproducibly, code that renders from source, dependencies pinned, everything under version control.