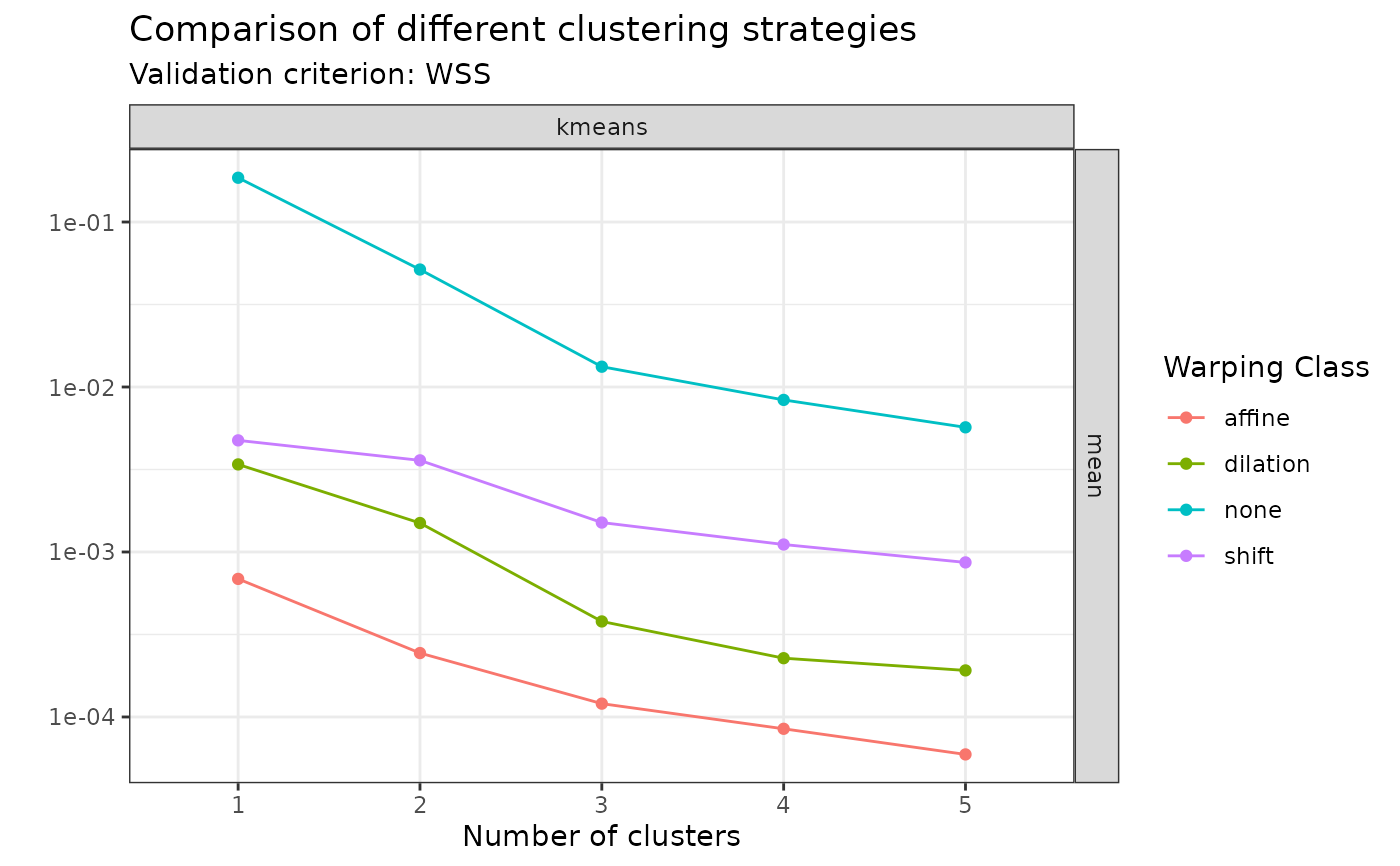
This is an S3 method implementation of the graphics::plot() generic for
objects of class mcaps to visualize the performances of multiple caps
objects applied on the same data sets either in terms of WSS or in terms of
silhouette values.
Arguments
- x
An object of class
mcaps.- validation_criterion
A string specifying the validation criterion to be used for the comparison. Choices are
"wss"or"silhouette". Defaults to"wss".- what
A string specifying the kind of information to display about the validation criterion. Choices are
"mean"(which plots the mean values) or"distribution"(which plots the boxplots). Defaults to"mean".- ...
Other arguments passed to specific methods.
Examples
plot(sim30_mcaps)