Plots the result of a clustering strategy stored in a caps object
Source: R/caps-plot.R
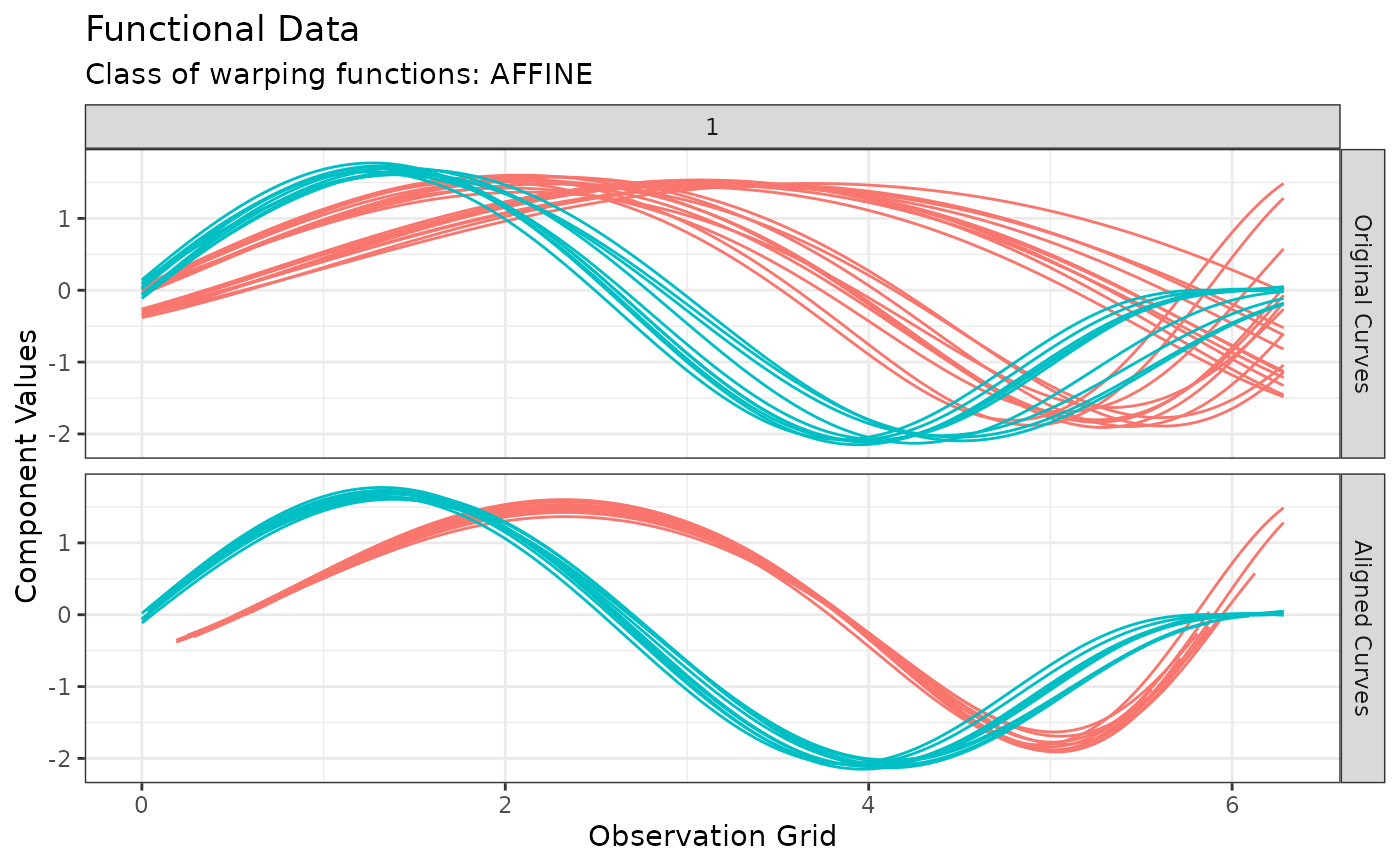
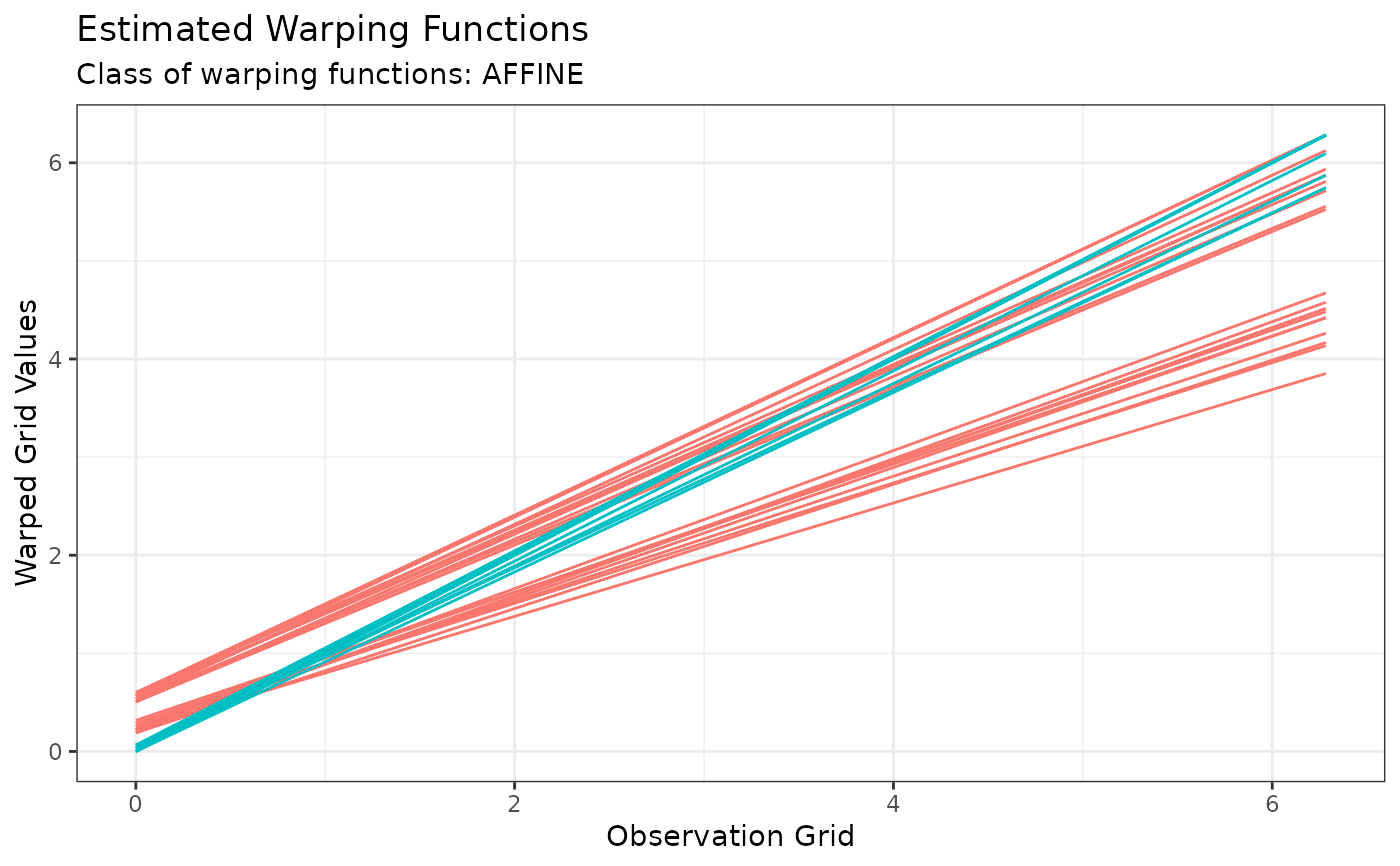
plot.caps.RdThis function creates a visualization of the result of the k-mean alignment algorithm without returning the plot data as an object. The user can choose to visualize either the amplitude information data in which case original and aligned curves are shown or the phase information data in which case the estimated warping functions are shown.
Arguments
- x
An object of class
caps.- type
A string specifying the type of information to display. Choices are
"amplitude"for plotting the original and aligned curves which represent amplitude information data or"phase"for plotting the corresponding warping functions which represent phase information data. Defaults to"amplitude".- ...
Not used.