Diagnostic plot for the result of a clustering strategy stored in a caps object
Source: R/caps-diagnostic.R
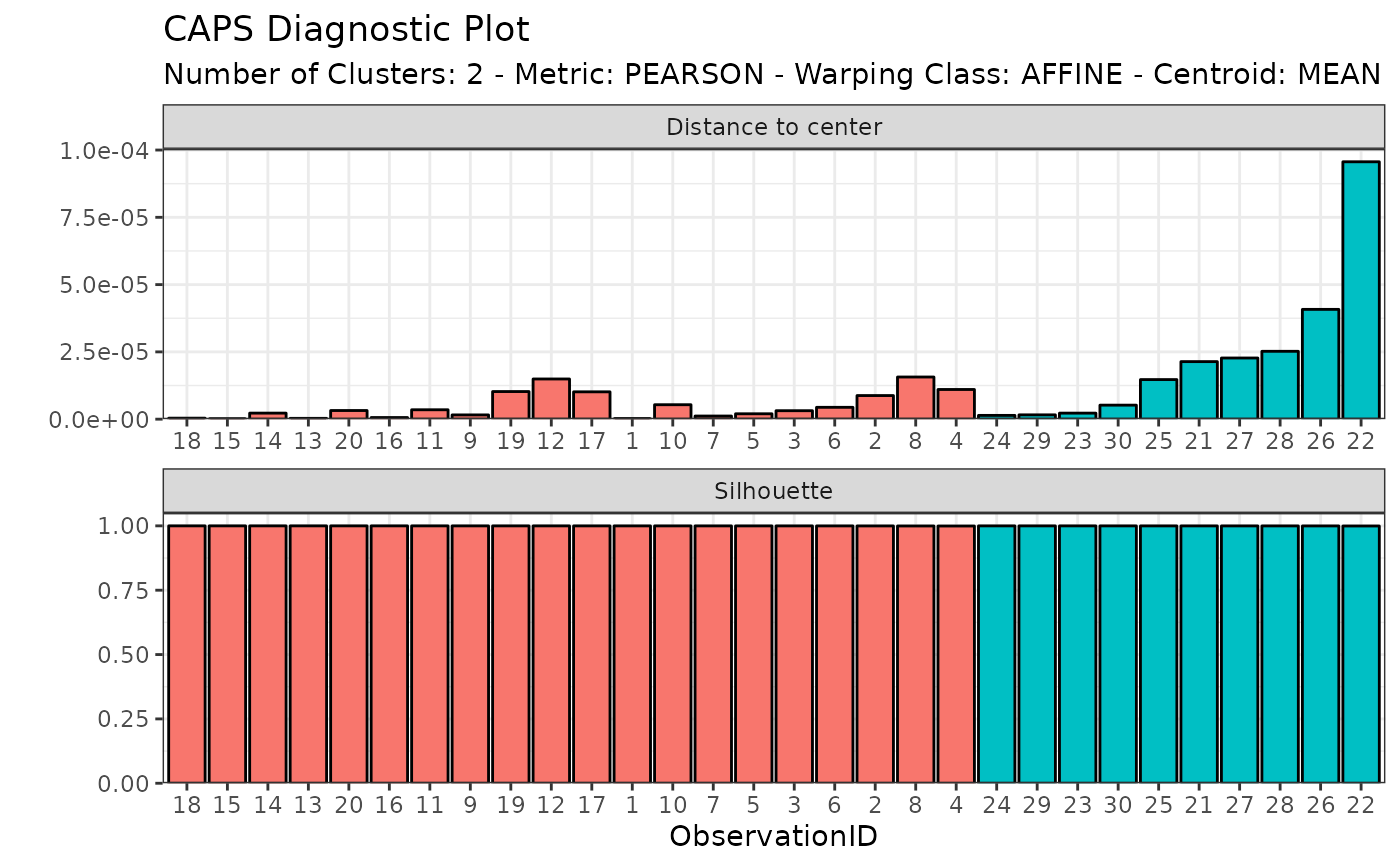
diagnostic_plot.RdThis function plots the values of the distance to center and silhouette for each observation. Observations are ordered within cluster by decreasing value of silhouette.
Arguments
- x
An object of class
caps.
Value
An object of class ggplot2::ggplot.