The TDAverse

Modular, interoperable, and extensible topological data analysis in R

Jason Cory Brunson

University of Florida

Aymeric Stamm

UMR CNRS 6629, Nantes University

July 9, 2026

Introductions

Aymeric Stamm

Aymeric Stamm

Jason Cory Brunson

Jason Cory Brunson

Topological Data Analysis (in R)

What is topological data analysis?

Topology is a branch of mathematics at the interface of geometry and analysis.

  • Geometry is the study of rigid shapes (angle, curvature, distance).
  • Analysis is the study of limits (continuity, smoothness).
  • Topology is the study of properties of shapes that are invariant under continuous deformations: \[\text{Topology} \, = \, \text{Geometry} \,\, / \,\, \text{Analysis}\]

The core of Topological Data Analysis is persistent homology.

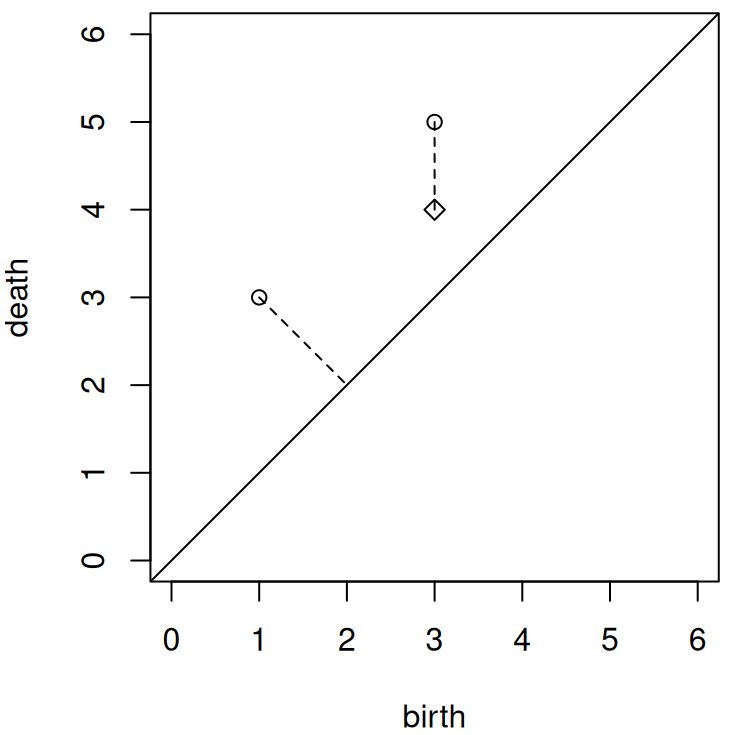
Persistent homology

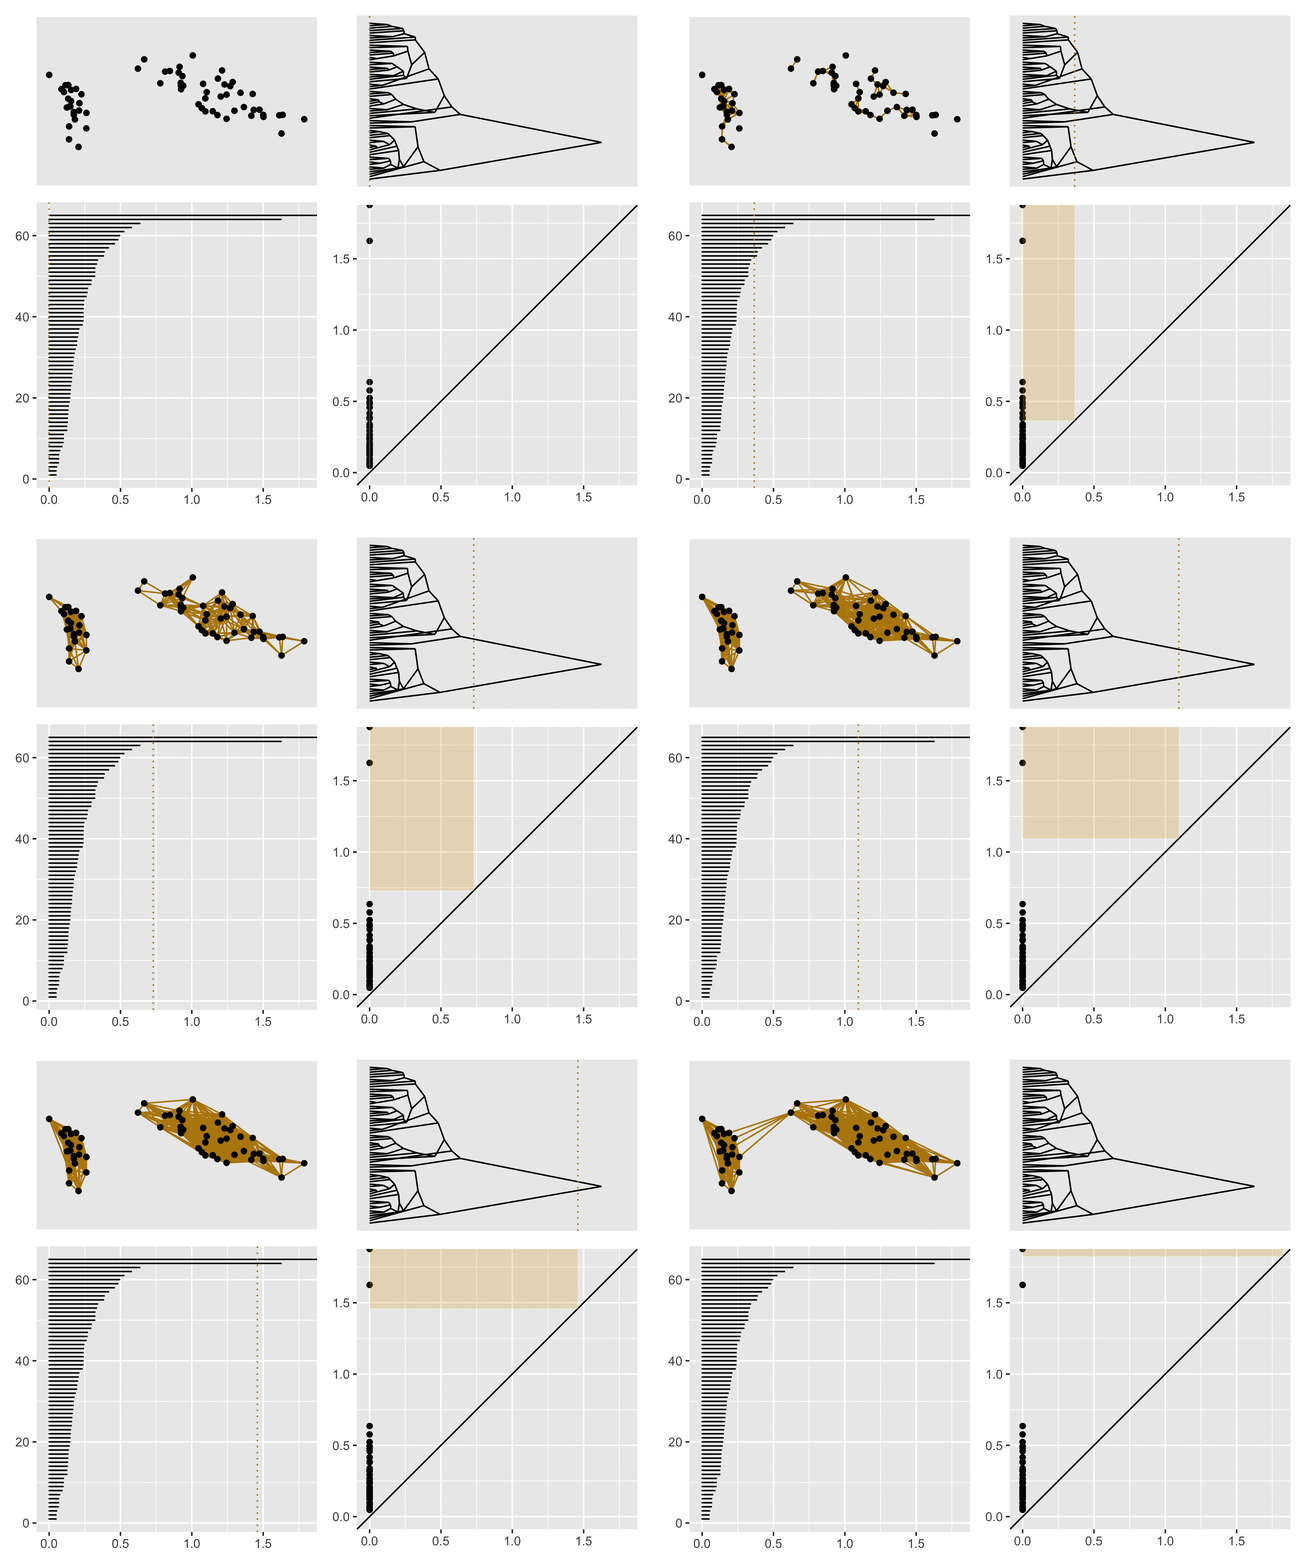
You’ve probably encountered 0-dimensional persistent homology before.

… better known as hierarchical clustering.


See Mémoli & Singhal (2019) for a theoretical primer that makes this precise.

Created with {ggtda} and {animate}.

Persistent homology

Persistent homology tracks not only

  1. connected components

but also

  1. loops (see figure),
  2. cells,

and

3+. higher-dimensional enclosures.
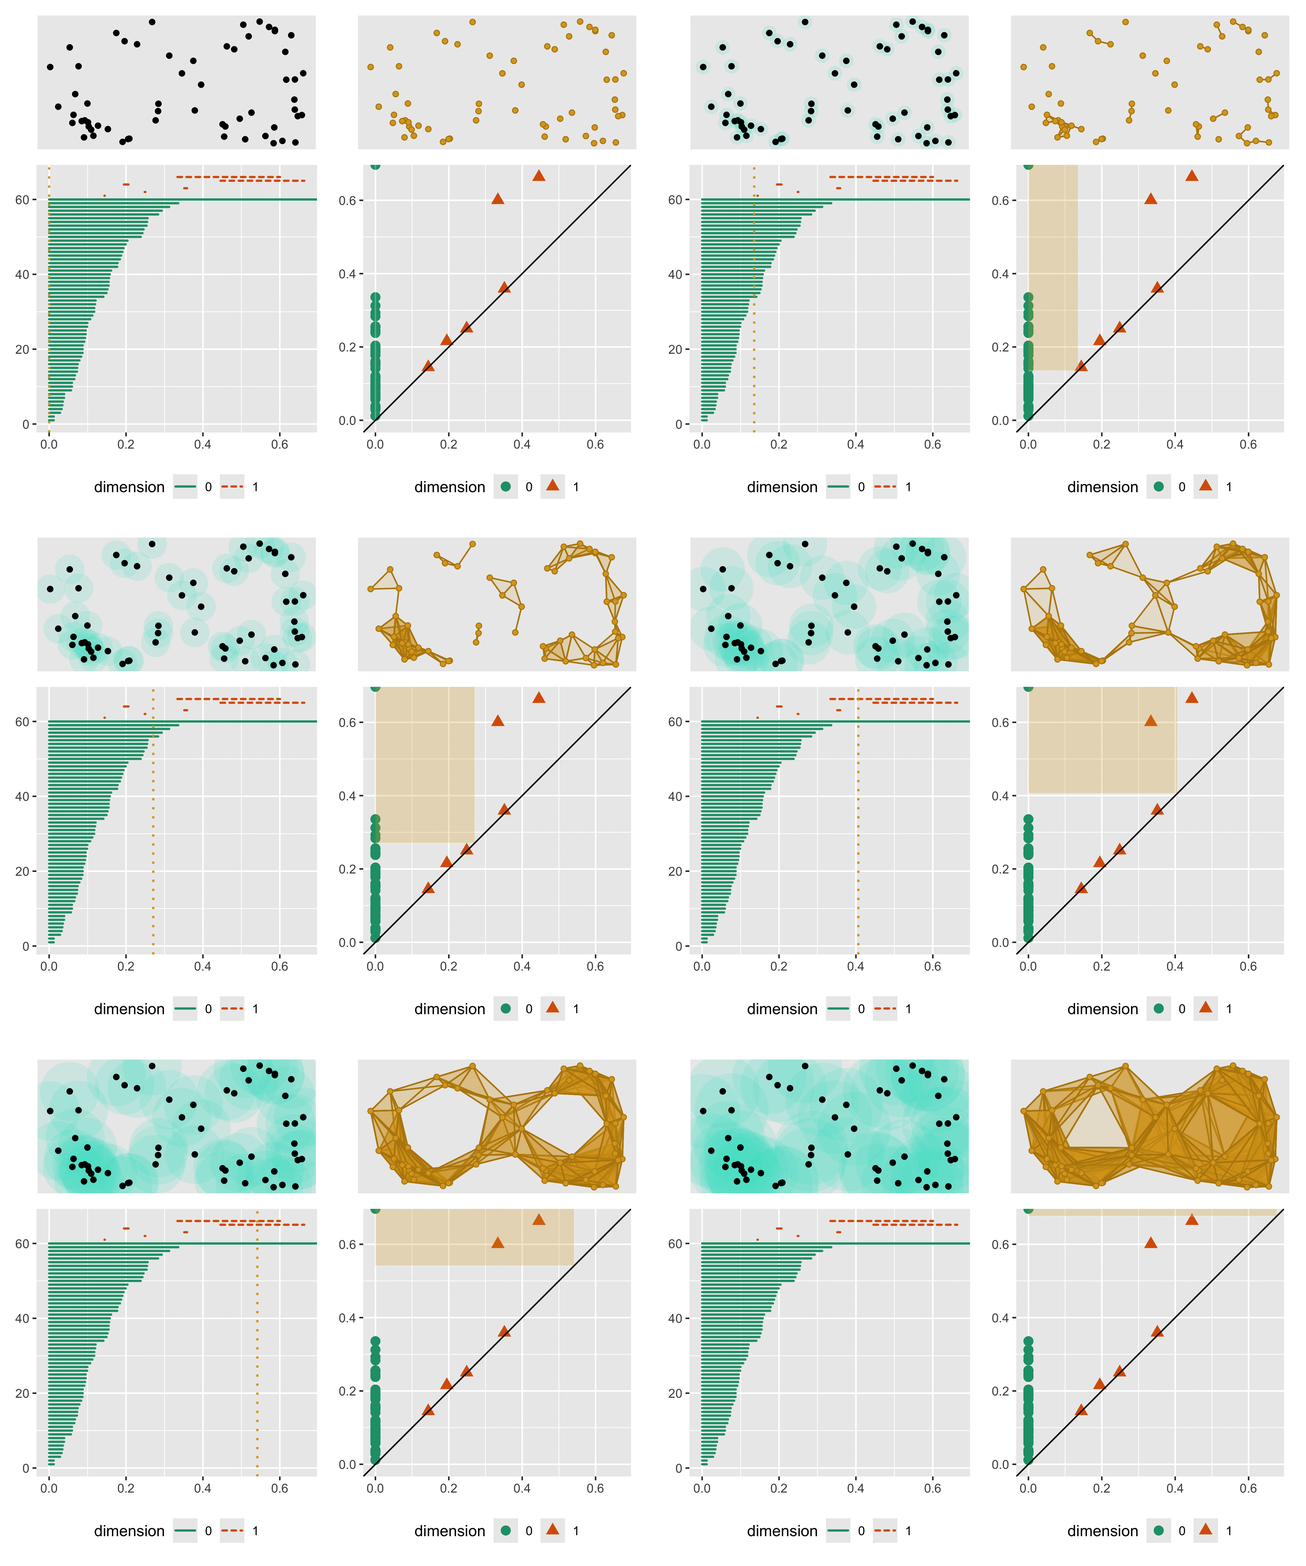
Created with {ggtda} and {animate}.

Applications of PH

… are numerous and diverse.

Check out the Database of Original & Non-theoretical Uses of Topology:

https://donut.topology.rocks/

How can R users do TDA?

We see (heretofore) R packages for TDA belonging to 3 types:

  • routine-specific

    (ripserr, simplextree, kernelTDA, TDAvec)

  • analysis-specific

    (TDAstats, TDApplied, ashapesampler, lookout)

  • general-purpose

    (TDA, TDAkit, rgudhi)

Each meets certain needs, but they form a fragile ecosystem:

  • duplication of methods
  • hidden dependencies
  • sensitivity to upgrades
  • difficulty coupling

The TDAverse

Raoul Wadhwa

Raoul Wadhwa

Matt Piekenbrock

Matt Piekenbrock

James Otto

James Otto

Design principles

Accessible

Empower users to learn and request.

  • Expressive names
  • Density of examples

Opinionated

Reduce burdens on collaborators & reviewers.

  • Evidence/practice-based defaults
  • Alert to any non-standard choices

Modular

Ease maintenance, contributions, and extensions.

  • Different packages for different tasks
  • Different packages for different steps

Interoperable

Reduce burdens on learners & programmers.

  • Unified structures & conventions
  • Co-extensions with other collections

These principles are inspired by those of other package collections and by our own experiences as enthusiasts, users, and developers in a niche area.

📦 Packages

Engines: {ripserr}

Goal of the package

  • Bindings to Ripser and related C++ libraries for computing persistent homology

Current features:

  • vietoris_rips() binding to Ripser
  • cubical() binding to Cubical Ripser
  • Helper functions to pre- and post-process data
Research Assistants

Bindings, enhancements, and other contributions by Kent Phipps, Sean Hershkowitz, and Alice Zhang.

Utilities: {phutil}

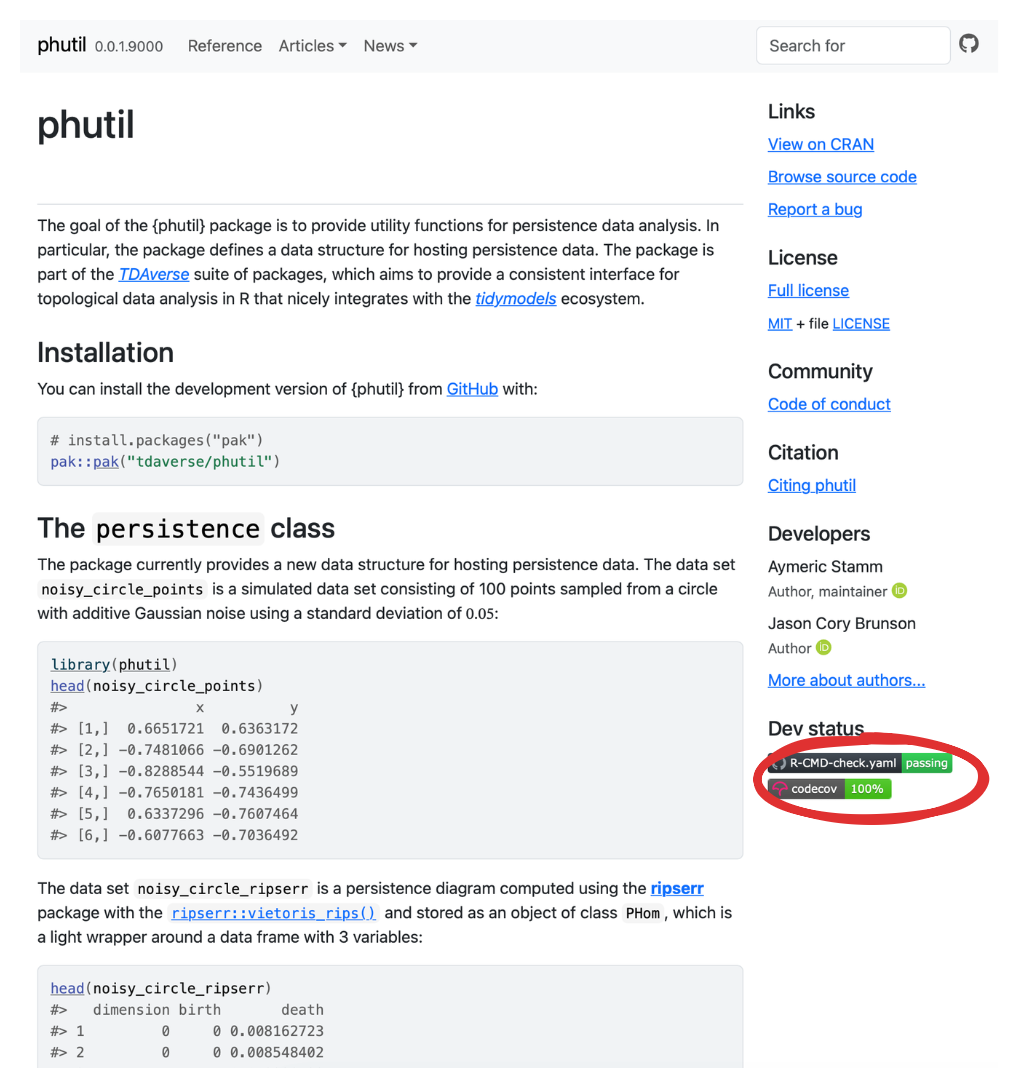
Goal of the package

  • Low-level package that defines a unifying toolbox for handling persistent homology data;
  • Stands for Persistent Homology Utilities.

Current features:

  • A ‘persistence’ class to store a single persistent diagram;
  • A ‘persistence_set’ class to store collections of persistent diagrams as a list of ‘persistence’ objects;
  • Functions to compute distances between persistence diagrams.
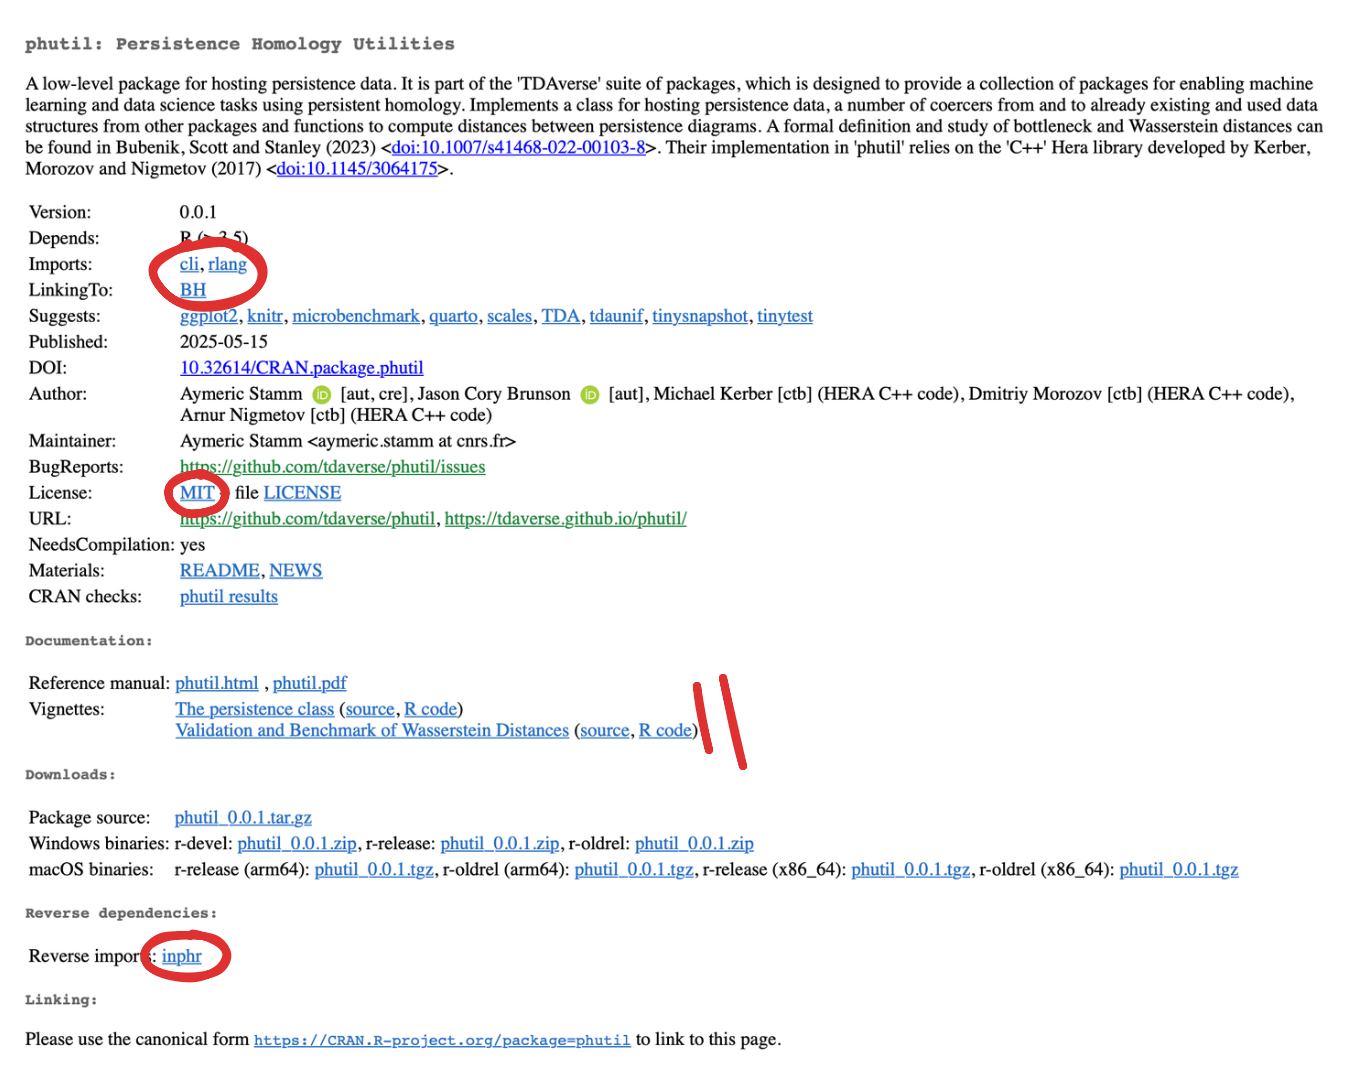
Figure 1: CRAN Webpage
Figure 2: GitHub Repository
Figure 3: Website

The persistence class

Decision-making process

  • Most common ways to represent persistent homology data? (e.g. existing R, Python and C/C++ libraries)
  • Most common operations on persistent homology data? (e.g. plotting, computing distances, etc.)
  • Trade-offs between memory efficiency, speed, and ease of use for statistical analysis?
  • Easy integration within machine learning pipelines.
library(phutil)
1
The package contains data sets for demonstration and testing purposes such as arch_spirals, a list of 24 persistence diagrams computed from samples of points in the plane forming two interlocking spirals.
class(arch_spirals[[1]])
2
Each element in arch_spirals is of class persistence.
[1] "persistence"
names(arch_spirals[[1]])
3
A persistence object is a list with two elements: pairs and metadata.
[1] "pairs"    "metadata"
str(arch_spirals[[1]]$pairs)
4
The pairs element is a list of matrices containing birth-death pairs for each homological dimension.
List of 3
 $ : num [1:120, 1:2] 0 0 0 0 0 0 0 0 0 0 ...
 $ : num [1:14, 1:2] 2.97 2.84 2.77 3 2.89 ...
 $ : num [1, 1:2] 2.82 2.83
str(arch_spirals[[1]]$metadata)
5
The metadata element is a list containing information about how the data was computed.
List of 6
 $ ordered_pairs: logi TRUE
 $ data         : symbol S2
 $ engine       : chr "TDA::ripsDiag"
 $ filtration   : chr "Vietoris-Rips"
 $ call         : language TDA::ripsDiag(X = S2, maxdimension = 2, maxscale = 6)
 $ parameters   :List of 2
  ..$ maxdimension: num 2
  ..$ maxscale    : num 6

Handling persistence objects

Coerce persistence objects to other common formats:

arch_spirals[[1]]
1
Print a persistence object. Calls the print() method which in turn calls format().

── Persistence Data ────────────────────────────────────────────────────────────
ℹ There are 120, 14, and 1 pairs in dimensions 0, 1, and 2 respectively.
ℹ Computed from a Vietoris-Rips filtration using `TDA::ripsDiag()`.
ℹ With the following parameters: maxdimension = 2 and maxscale = 6.
arch_spirals[[1]] |>
  as.matrix() |>
  head()
2
Coerce a persistence object to a matrix.
     dimension birth    death
[1,]         0     0 6.000000
[2,]         0     0 1.940172
[3,]         0     0 1.634614
[4,]         0     0 1.446407
[5,]         0     0 1.249571
[6,]         0     0 1.226760
arch_spirals[[1]] |>
  as.data.frame() |>
  head()
3
Coerce a persistence object to a data.frame.
  dimension birth    death
1         0     0 6.000000
2         0     0 1.940172
3         0     0 1.634614
4         0     0 1.446407
5         0     0 1.249571
6         0     0 1.226760

Handling persistence objects

Coerce from objects of class ‘diagram’ produced by TDA::*Diag() functions, objects of class ‘PHom’ produced by ripserr::vietoris_rips() and objects of class ‘hclust’ produced by stats::hclust().

library(TDA)
1
Load the {TDA} package.
torus_spl <- torusUnif(300, a = 1.8, c = 5)
2
Sample 300 points from a torus in \(R^3\).
torus_dgm <- ripsDiag(

  torus_spl,
  maxdimension = 1,
  maxscale = 2
)$diagram
3
Compute the Vietoris-Rips persistence diagram up to dimension 1 and scale 2.
class(torus_dgm)
4
The output is of class ‘diagram’.
[1] "diagram"
torus_pers <- as_persistence(torus_dgm)
5
Coerce the diagram to class persistence.
class(torus_pers)
6
The output is now of class persistence.
[1] "persistence"
torus_pers
7
Print the persistence object.

── Persistence Data ────────────────────────────────────────────────────────────
ℹ There are 300 and 73 pairs in dimensions 0 and 1 respectively.
ℹ Computed from a Vietoris-Rips filtration using `::ripsDiag()`.
ℹ With the following parameters: maxdimension = 1 and maxscale = 2.

Distances between diagrams

Dependencies

  • Hera C++ library bundled within {phutil};
  • {BH} as a LinkingTo dependency for providing access to the Boost headers for built-in Hera compilation.
  • OpenMP for parallelization (optional; enabled at installation if available).

Implemented distances1

  • The \(p\)-Wasserstein distance: \(W_p^q (X, Y) = \inf_{\varphi : X \to Y} \left( \sum_{x \in X} \left\| x - \varphi(x) \right\|_q^p \right)^{1/p}\)
  • The bottleneck distance: \(W_\infty^q (X, Y) = \inf_{\varphi : X \to Y} \left( \sup_{x \in X} \left\| x - \varphi(x) \right\|_q \right)\)

where \(X\) and \(Y\) are two persistence diagrams, \(\varphi\) is a bijection between the points of \(X\) and \(Y\) (including points on the diagonal), and \(\| \cdot \|_q\) is the \(q\)-norm in the plane.

Available functions: bottleneck_distance(), wasserstein_distance(), bottleneck_pairwise_distances and wasserstein_pairwise_distances().

Distances between diagrams

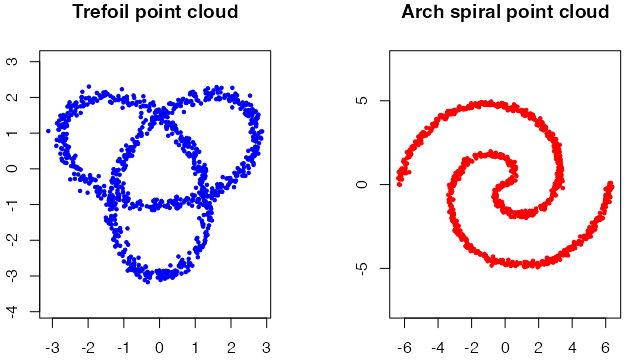
tdaunif::sample_trefoil(n = 1000, sd = 0.1)
tdaunif::sample_arch_spiral(n = 1000, sd = 0.1, arms = 2)
Figure 4: Sampling within two different geometries: 24 point clouds of size 1000 for each geometry.

Distances between diagrams

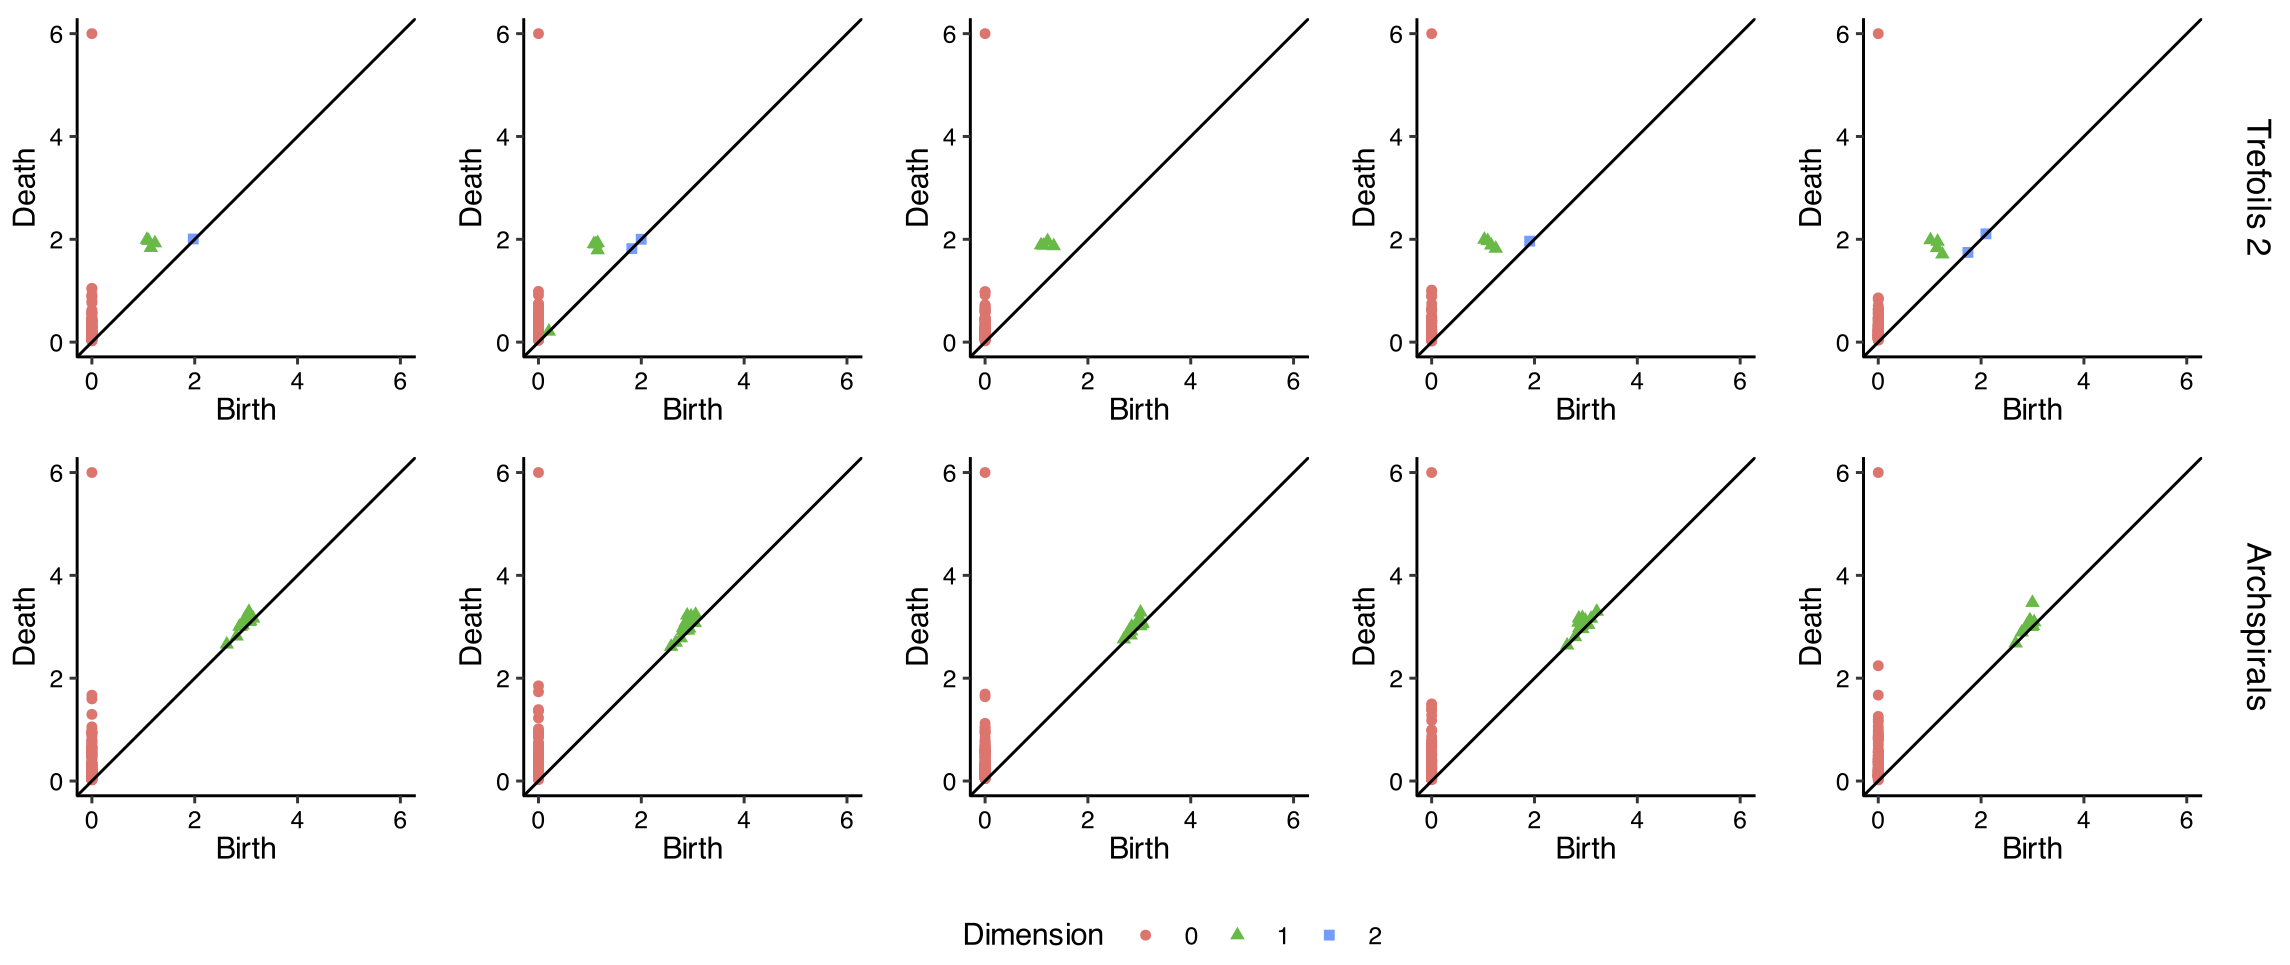
TDA::ripsDiag( ... ) # on each point cloud
ph_set <- phutil::as_persistence_set(c(trefoils, arch_spirals))
Figure 5: An overview of the persistence set: for each sample, we show the first 5 persistence diagrams computed via TDA::ripsDiag() and visualized with {ggtda}.

Distances between diagrams

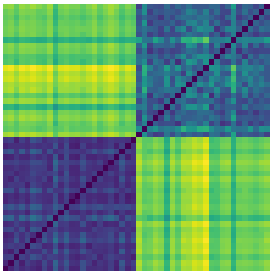
D <- wasserstein_pairwise_distances(
  ph_set,        # A list of persistence objects
  p = 2,         # The order of the Wasserstein distance
  dimension = 0, # The homological dimension to consider
  ncores = 12    # The number of CPU cores to use
)
Figure 6: Within- and between-block matrix representation of the pairwise distances between persistence diagrams.

Distances between diagrams

P <- cmdscale(D, k = 2)
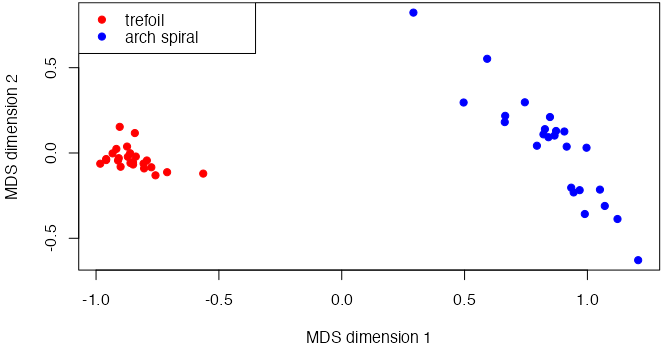
Figure 7: Multidimensional scaling projection of the persistence diagrams.

Recipes: {tdarec}

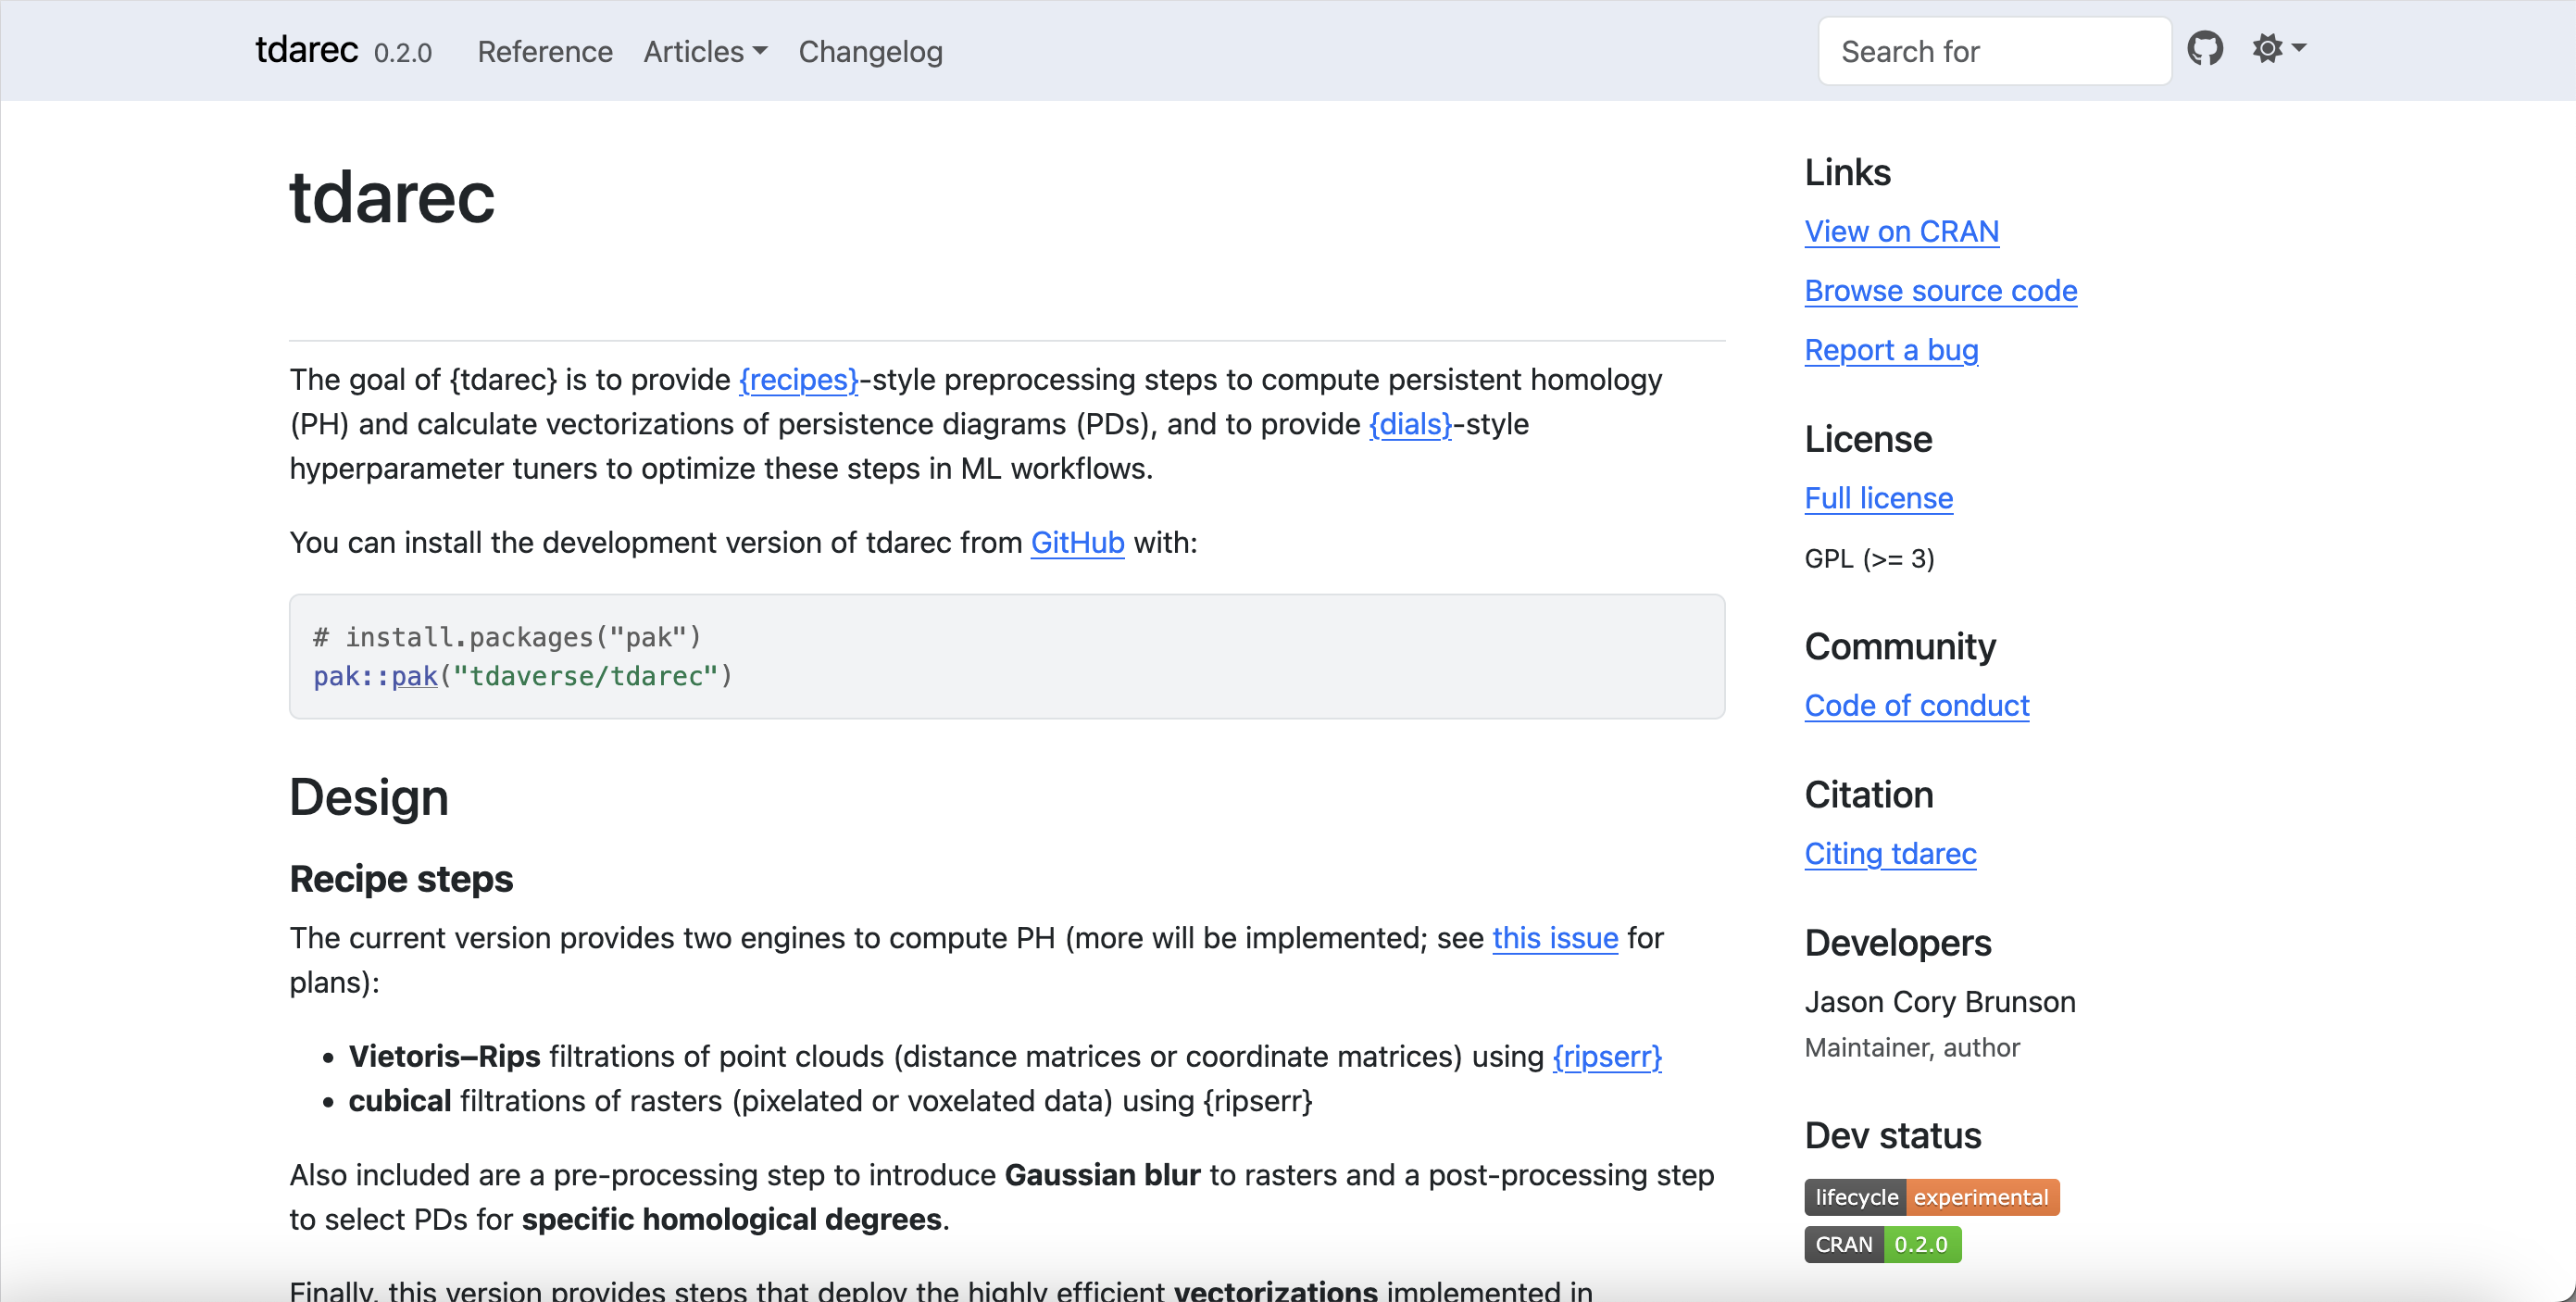
Tidymodels extension for persistent homology and its vectorizations

Current features:

  • {ripserr}-powered recipe steps to compute persistent homology from data
  • {TDAvec}-powered recipe steps to compute numeric features from persistent diagrams
  • Miscellaneous related pre-processing steps
  • Tunable dials for parameters governing the above
Collaborators

Umar Islambekov and Aleksei Luchinsky coordinated development of {TDAvec} with the scope and needs of {tdarec}.


Inference: {inphr}

Existing packages

Limitations

  • {TDA}: makes inference on a single diagram only;
  • {TDAstats}: compares two diagrams only;
  • {TDAkit}: compares functional summaries only.

Inference: {inphr}

Goal of the package

Comparing populations of persistence diagrams

  • using permutation hypothesis testing;
  • involving several collections of persistence diagrams.

Current features

  • two_sample_diagram_test():

    • permutation test for comparing two collections of persistence diagrams
    • uses the \(p\)-Wasserstein distance;
    • permutes the rows and columns of the distance matrix to compute the empirical distribution of one or more test statistics based on inter-point distances (Lovato et al. 2021);
  • two_sample_functional_test():

    • permutation test for comparing two collections of persistence diagrams based on some functional summary of them;
    • achieved using the interval-wise testing procedure of Pini and Vantini (2017).

Dependencies

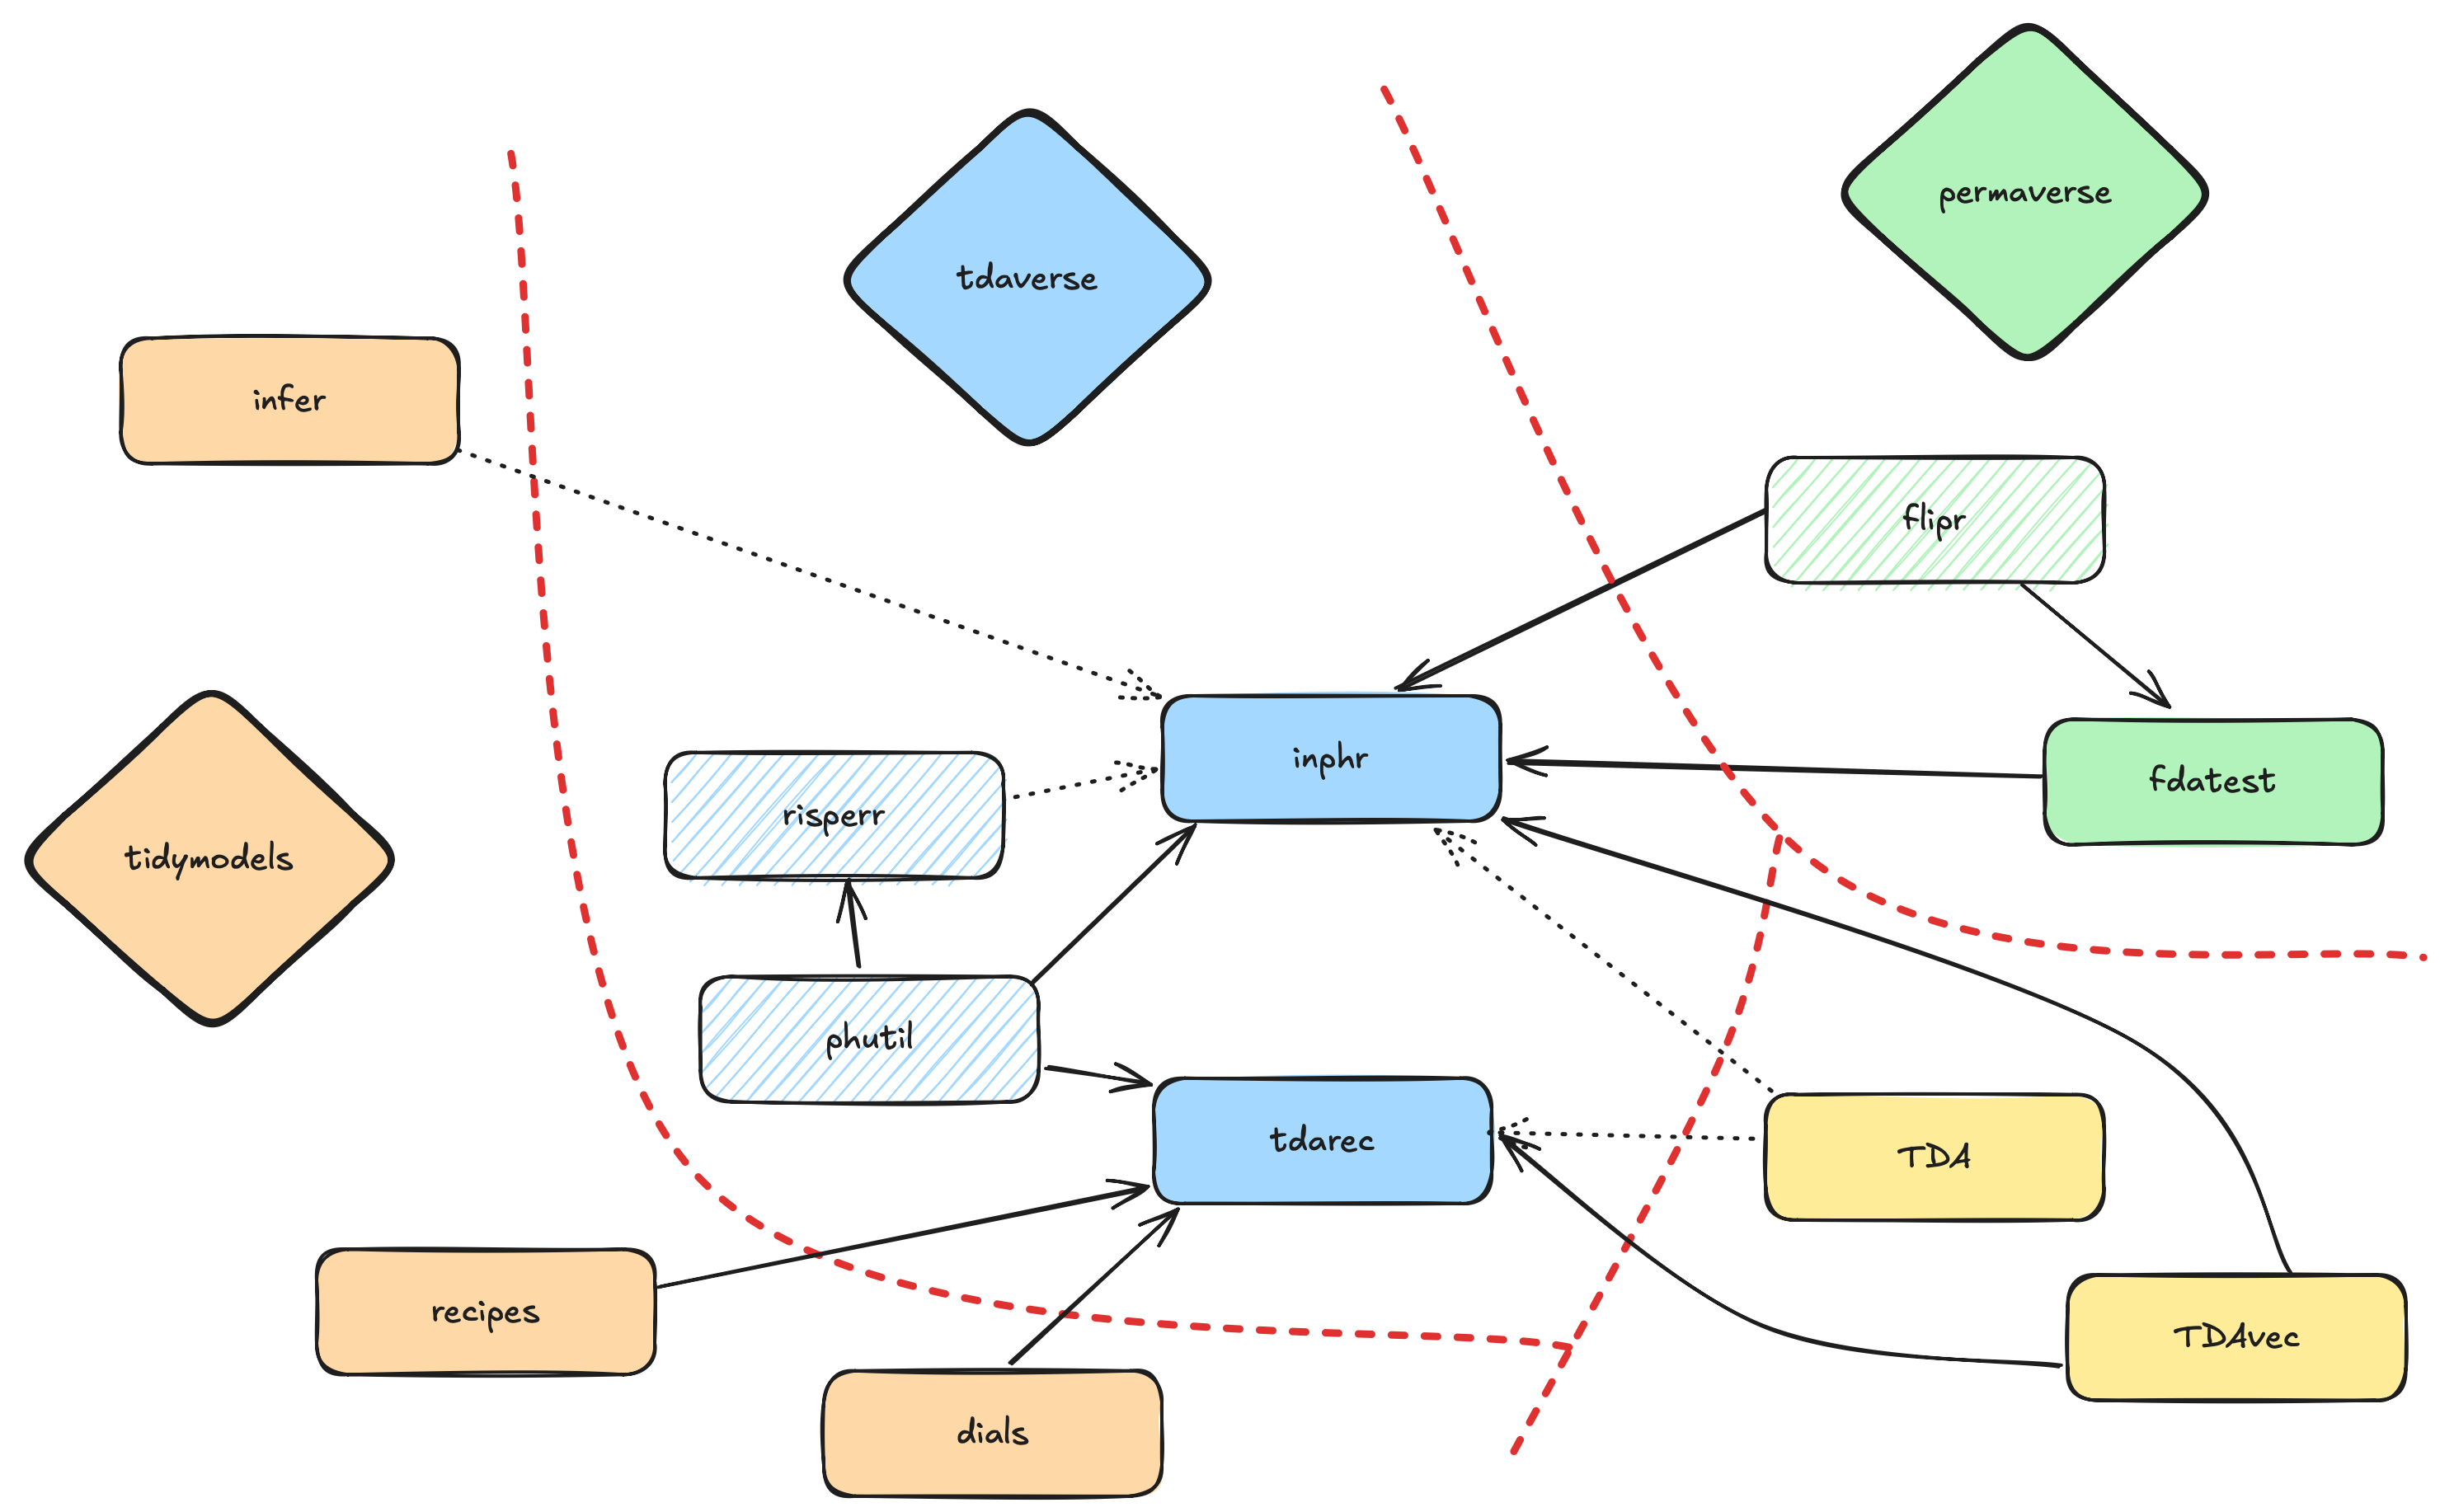
A schematic view of {inphr}’s dependencies.

A schematic view of {inphr}’s dependencies.

Invitations

Connecting multiple universes

Future developments

Packages in development

  • {ggtda}: {ggplot2} extension for persistence data
  • {plt}: binding to the Persistence Landscapes Toolbox C++ library
  • {rgp}: binding to the ReebGraphPairing Java program
  • {landmark}: shape-preserving subsampling methods

Packages in incubation

  • {pheng}: engine deployment for persistent homology
  • {phrou}: bindings to common routines

Packages in limbo

  • {Mapper}: R6 classes for mapper constructions
  • {Cover}: R6 classes for topological covers

Concluding remarks

Contributing to the TDAverse

Acknowledgments

🙏 This work was funded by an ISC grant from the R Consortium that we would like to gratefully acknowledge.