R, un catalyseur d’interdisciplinarité
Tour d’horizon du projet eGait sur l’analyse de la marche

Department of Mathematics Jean Leray, UMR CNRS 6629, Nantes University, Ecole Centrale de Nantes, France
2025-05-21
Why R?
Some reasons to use R
- Common language between statisticians, data scientists and biostatisticians
- Used in academia and industry
- Open-source, free, well-curated CRAN repo, well-documented
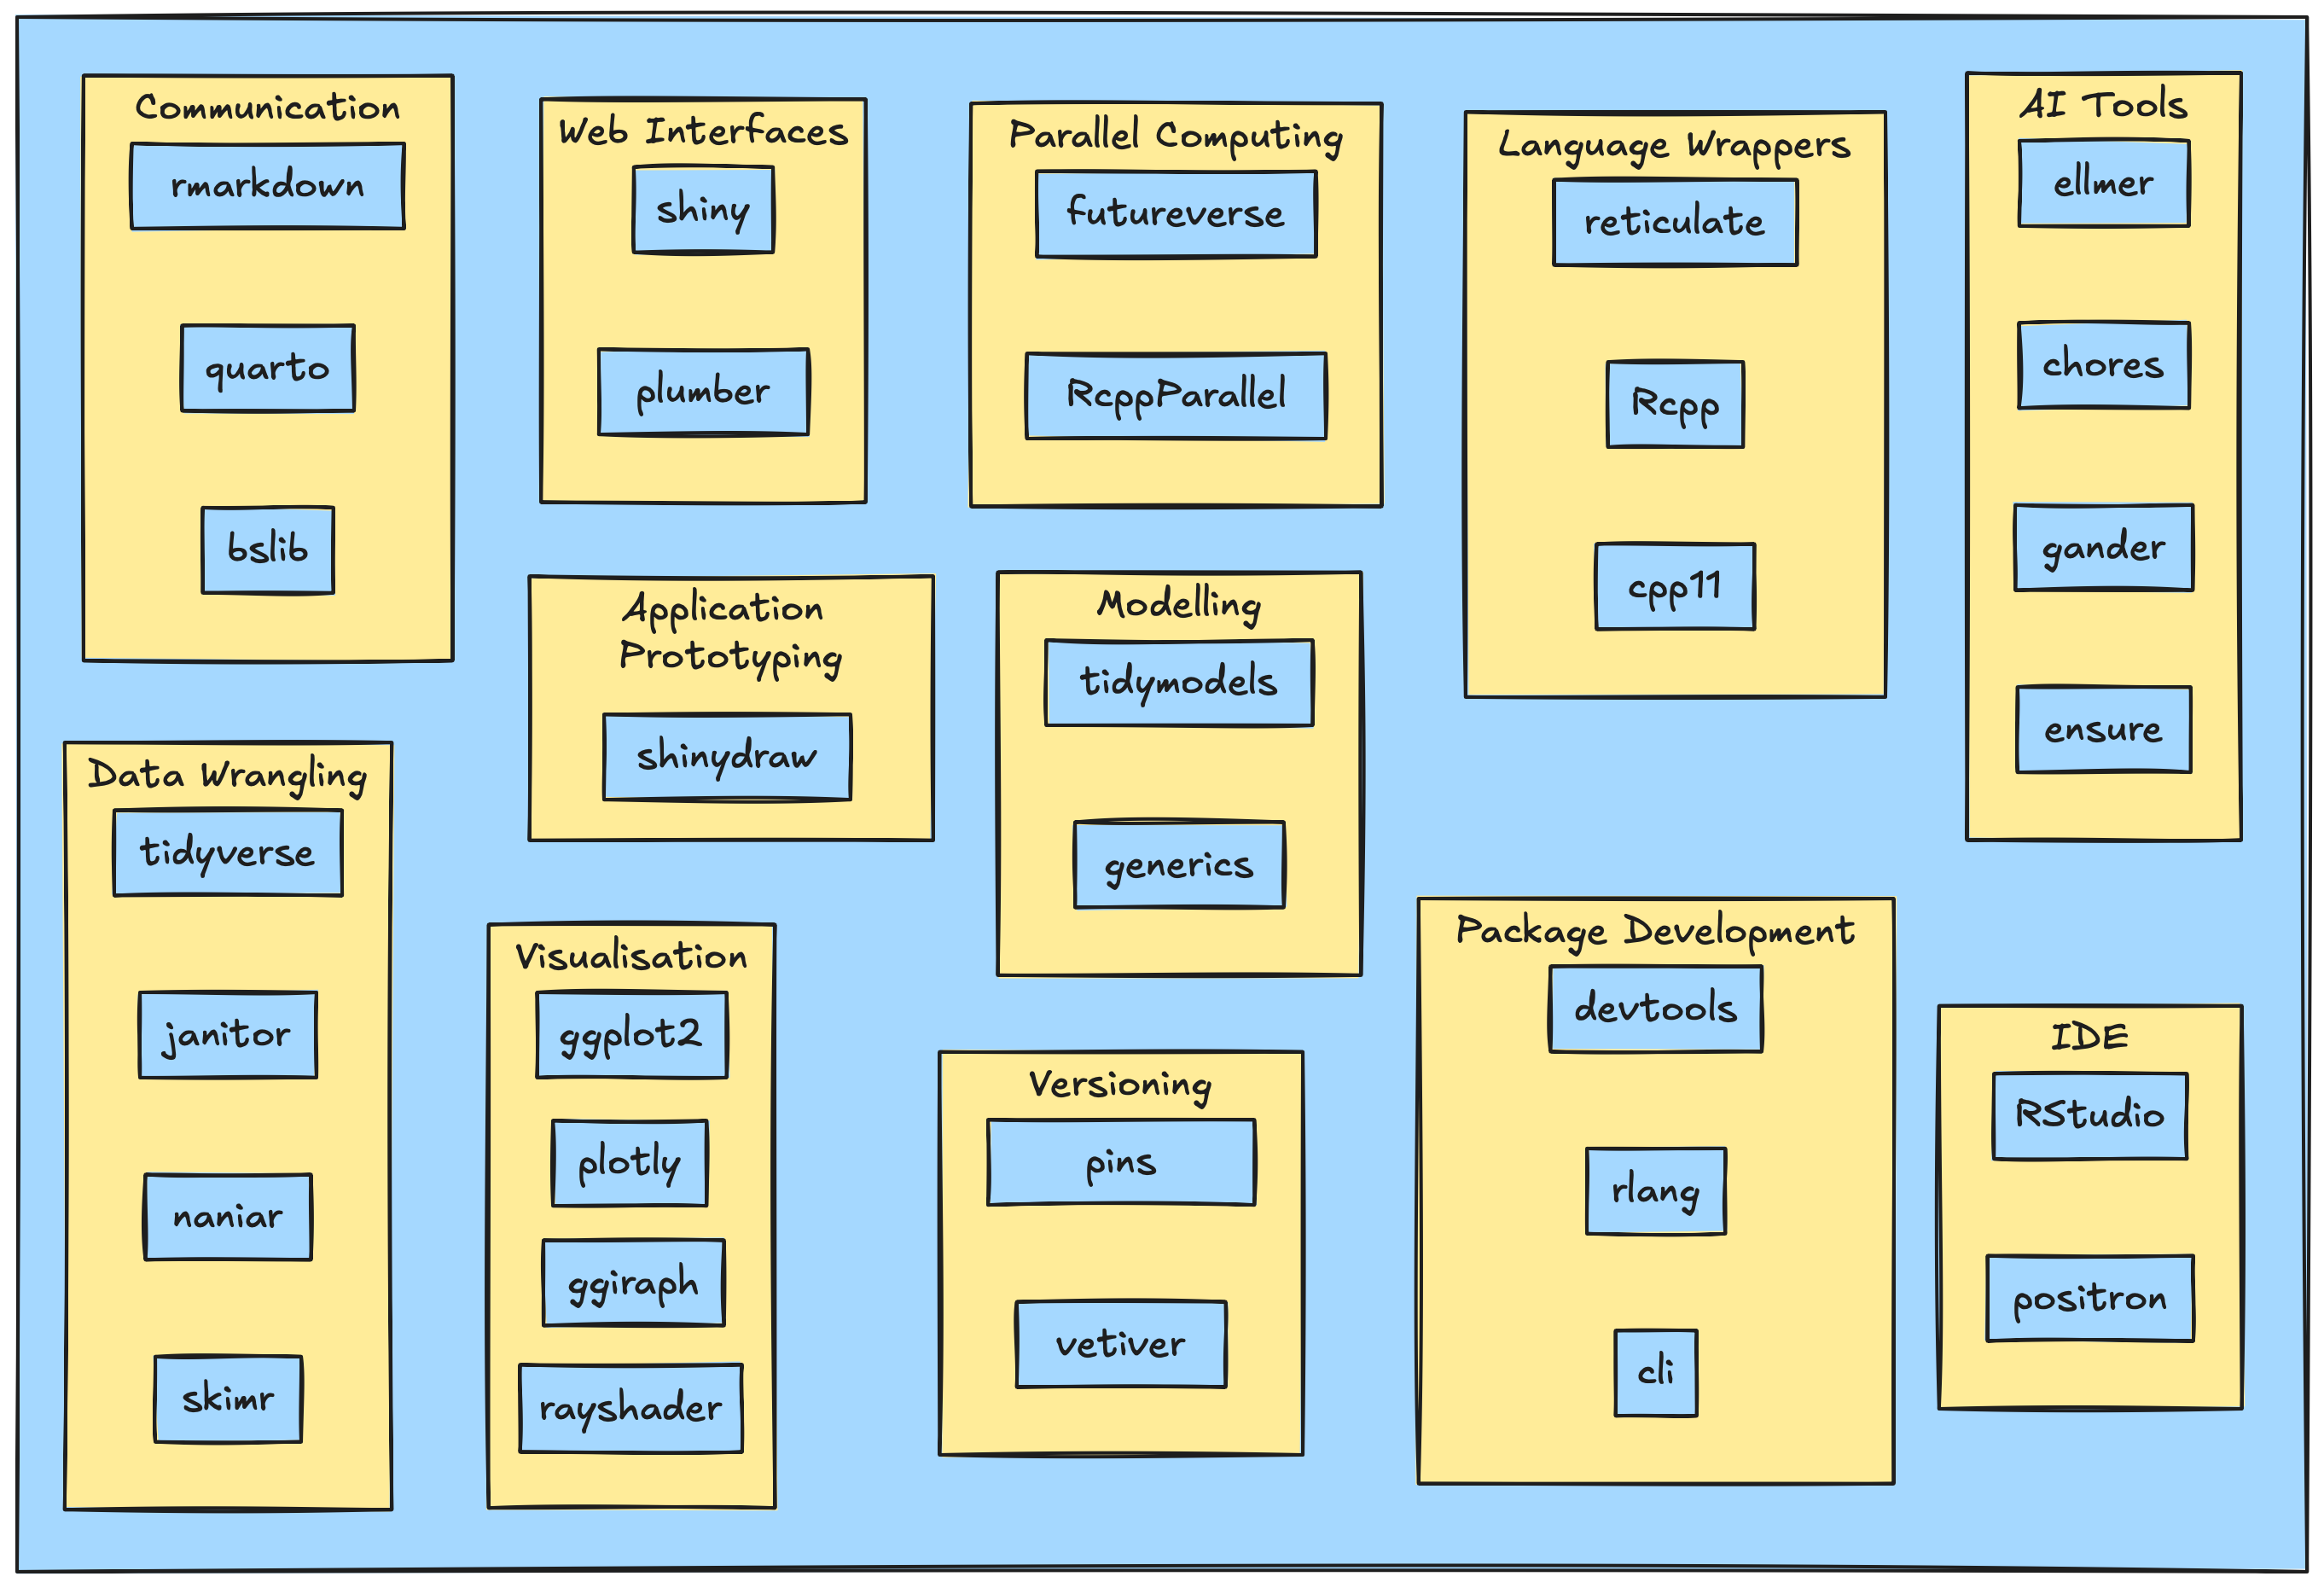
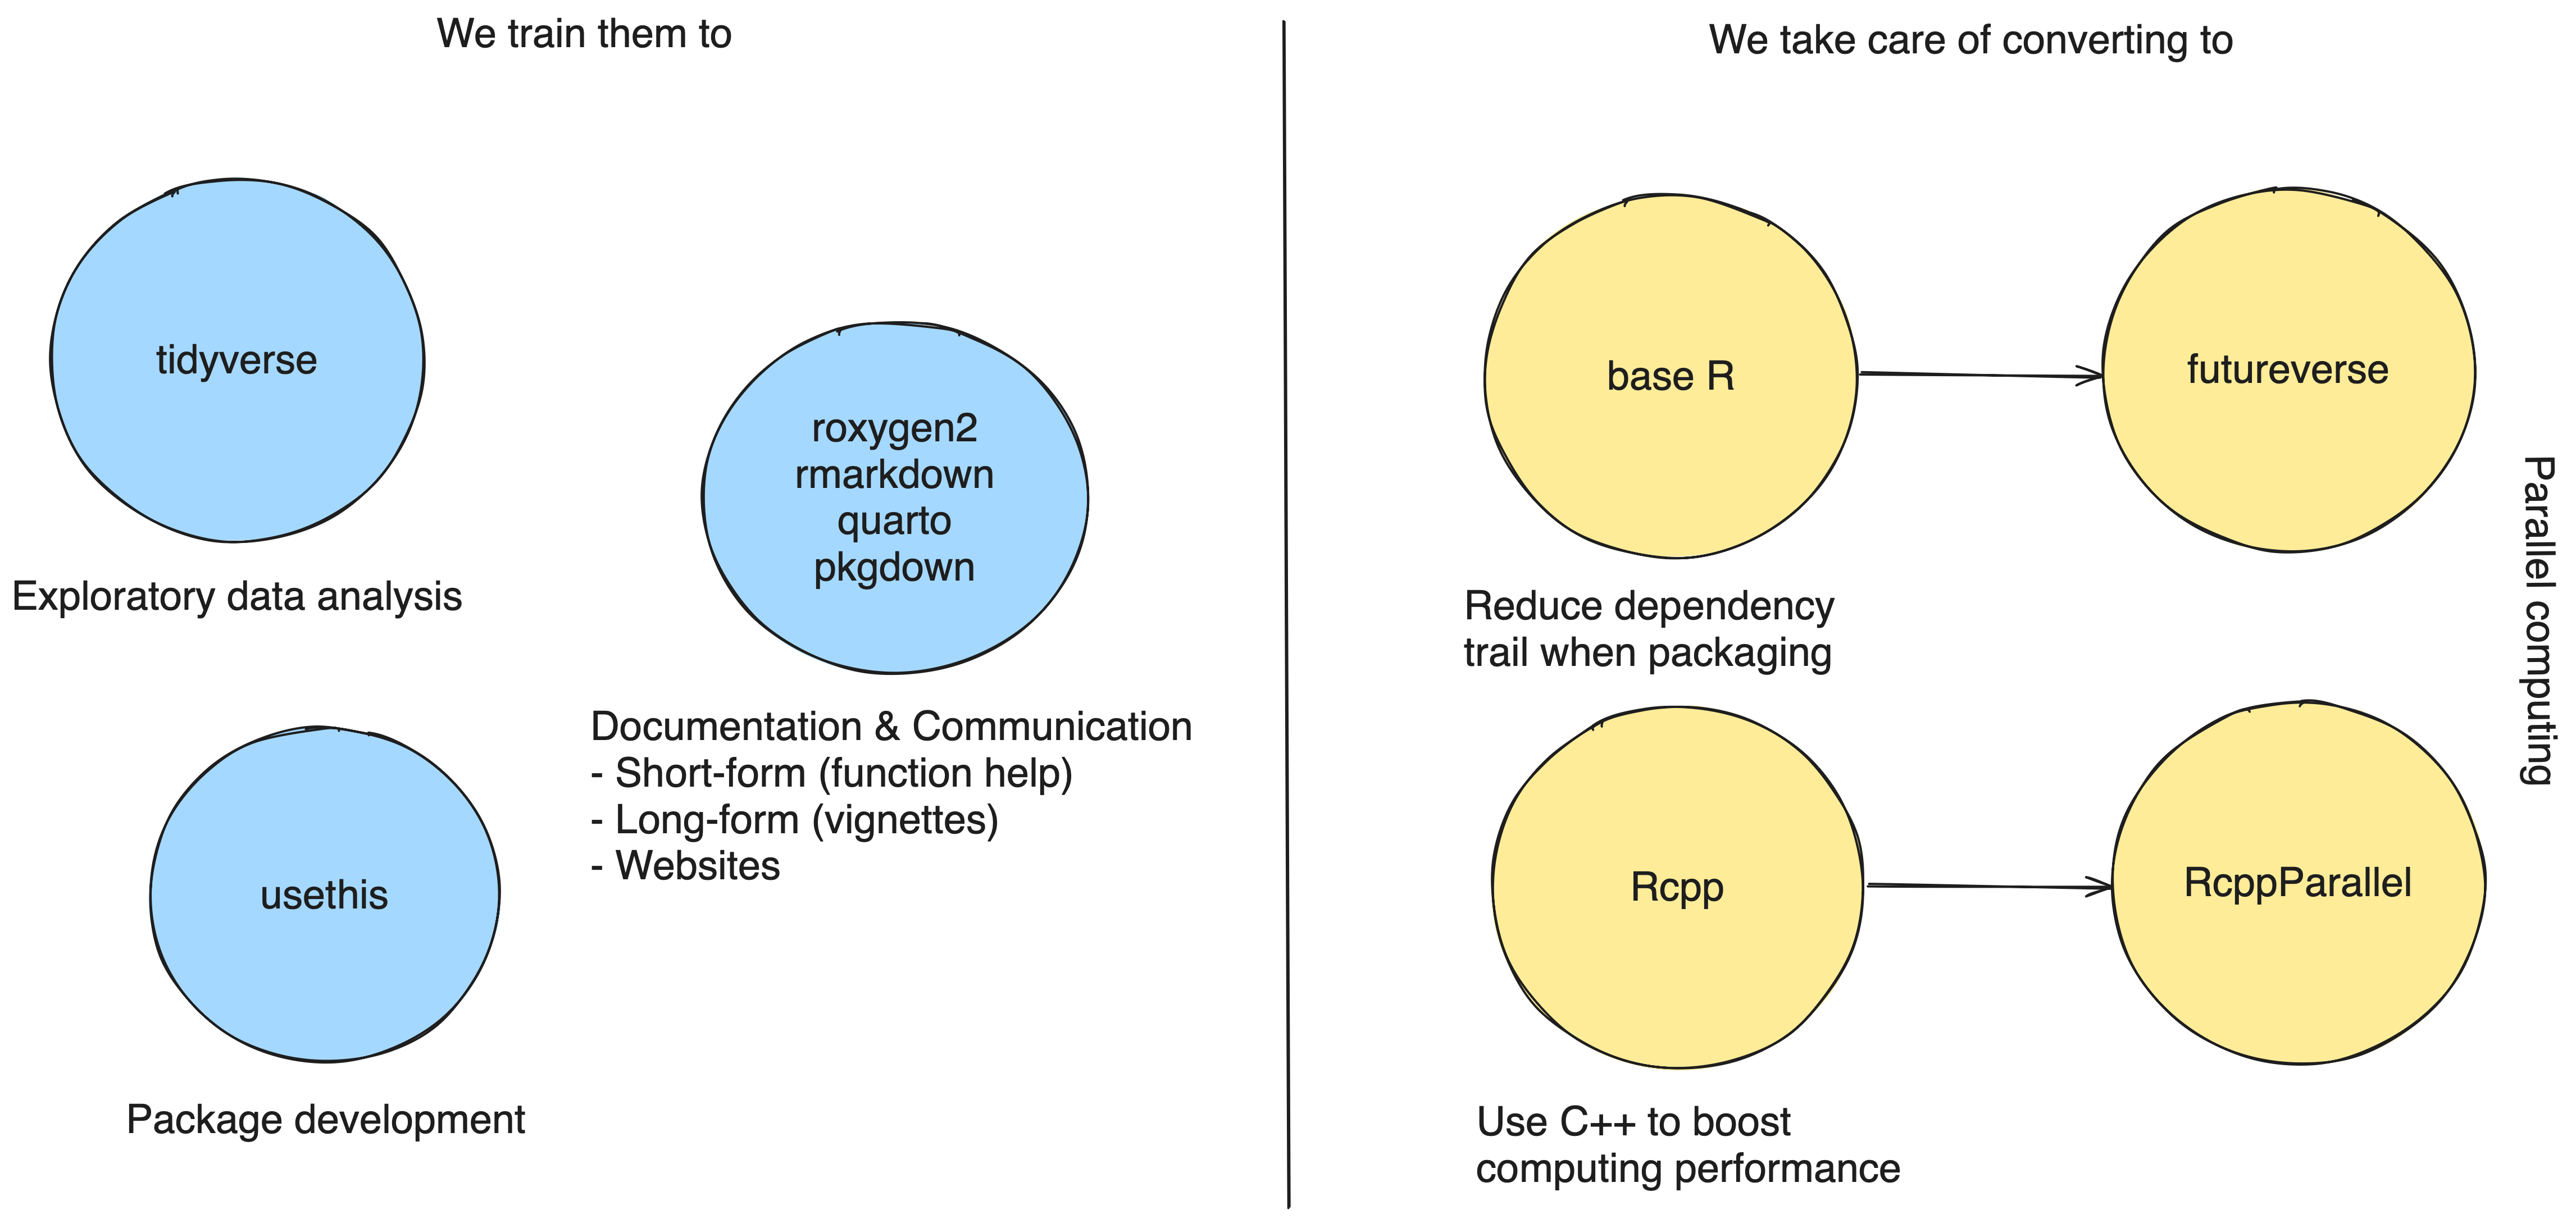
- Lots of recent efforts to improve the R ecosystem:
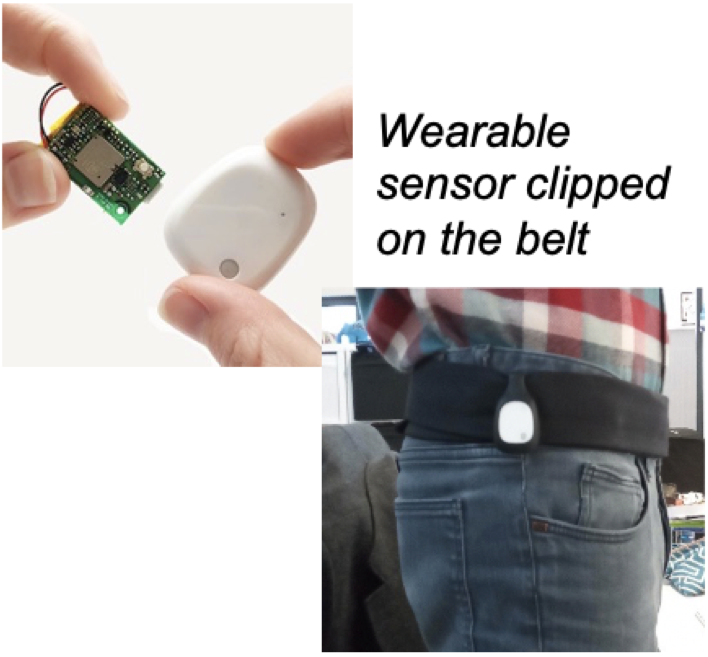
The eGait device
- An inertial measurement unit (IMU): defines the data (orientation e.g. 3D rotations over time),
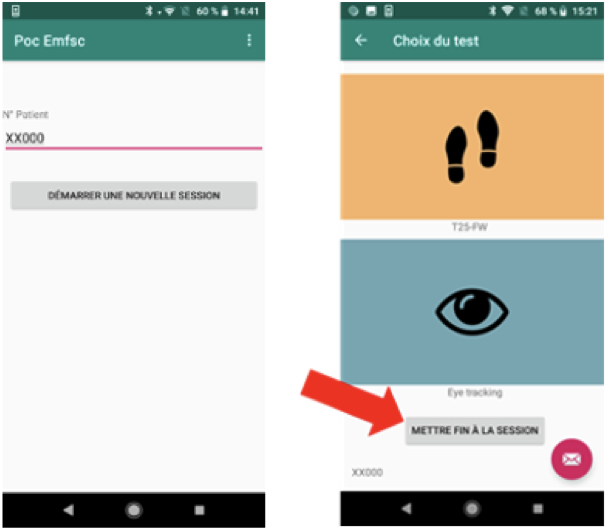
- A smartphone application: collects the data,
- Statistical methods for rotation-valued functional data: analyses the data
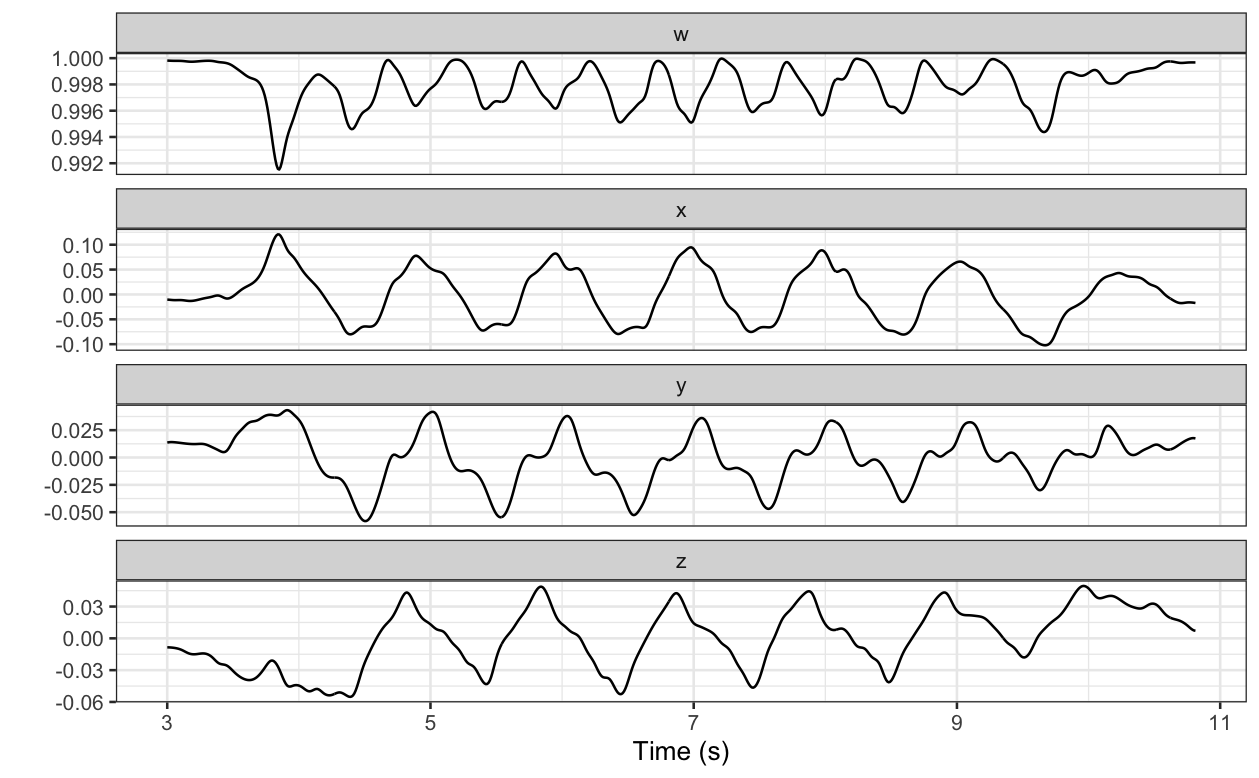
Rotation data from the sensor
Raw data collected by the eGait device:
- Represents the hip rotation over time (Drouin 2022);
- In the form of a unit quaternion time series.
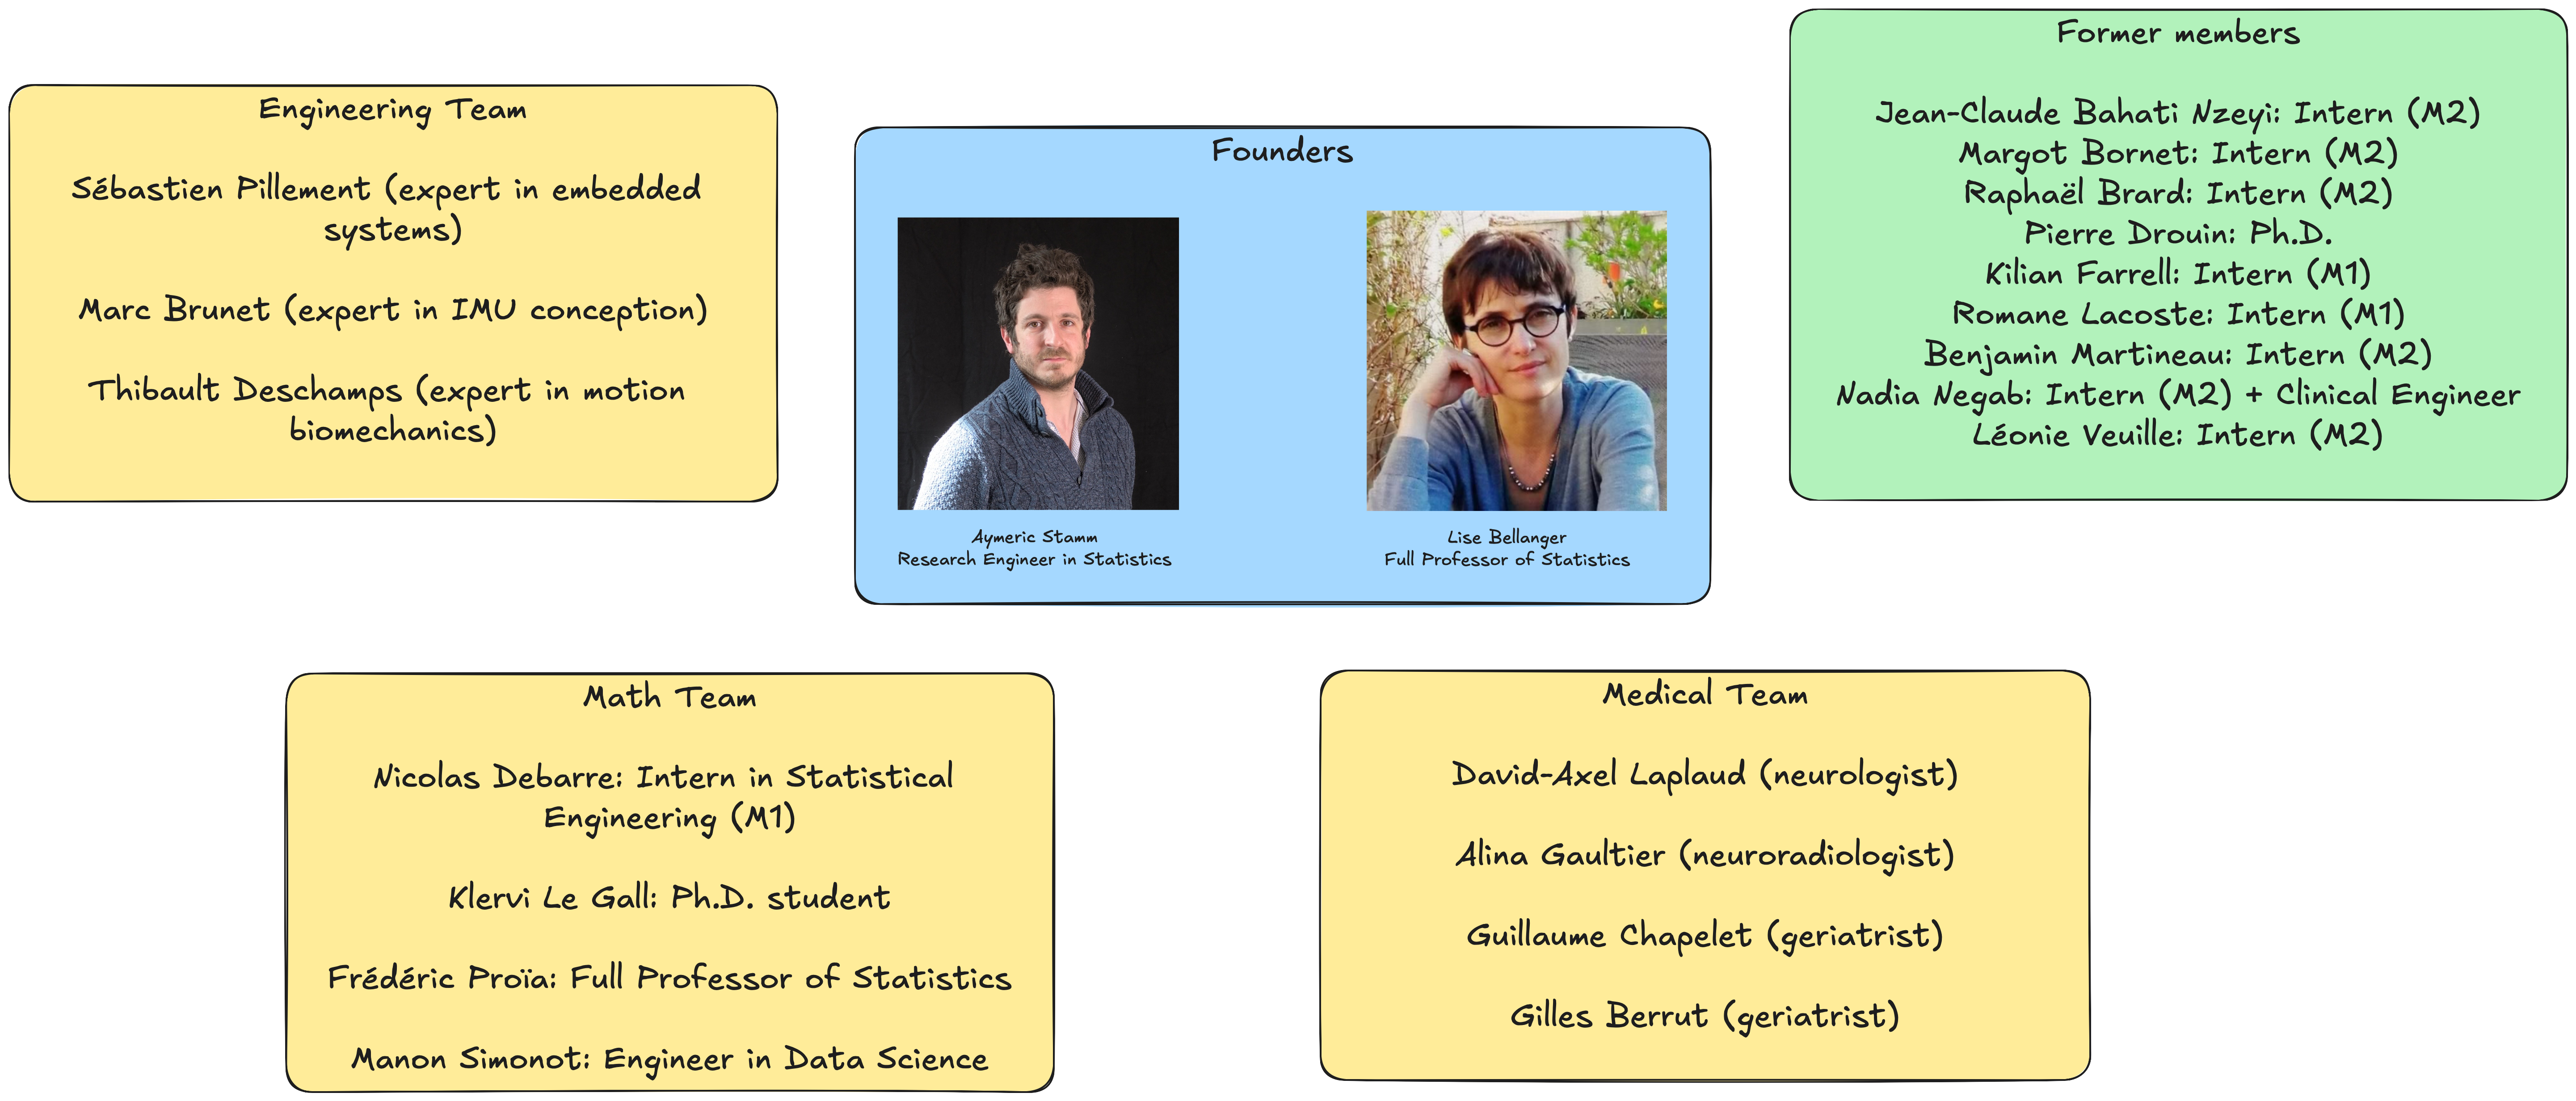
The Team
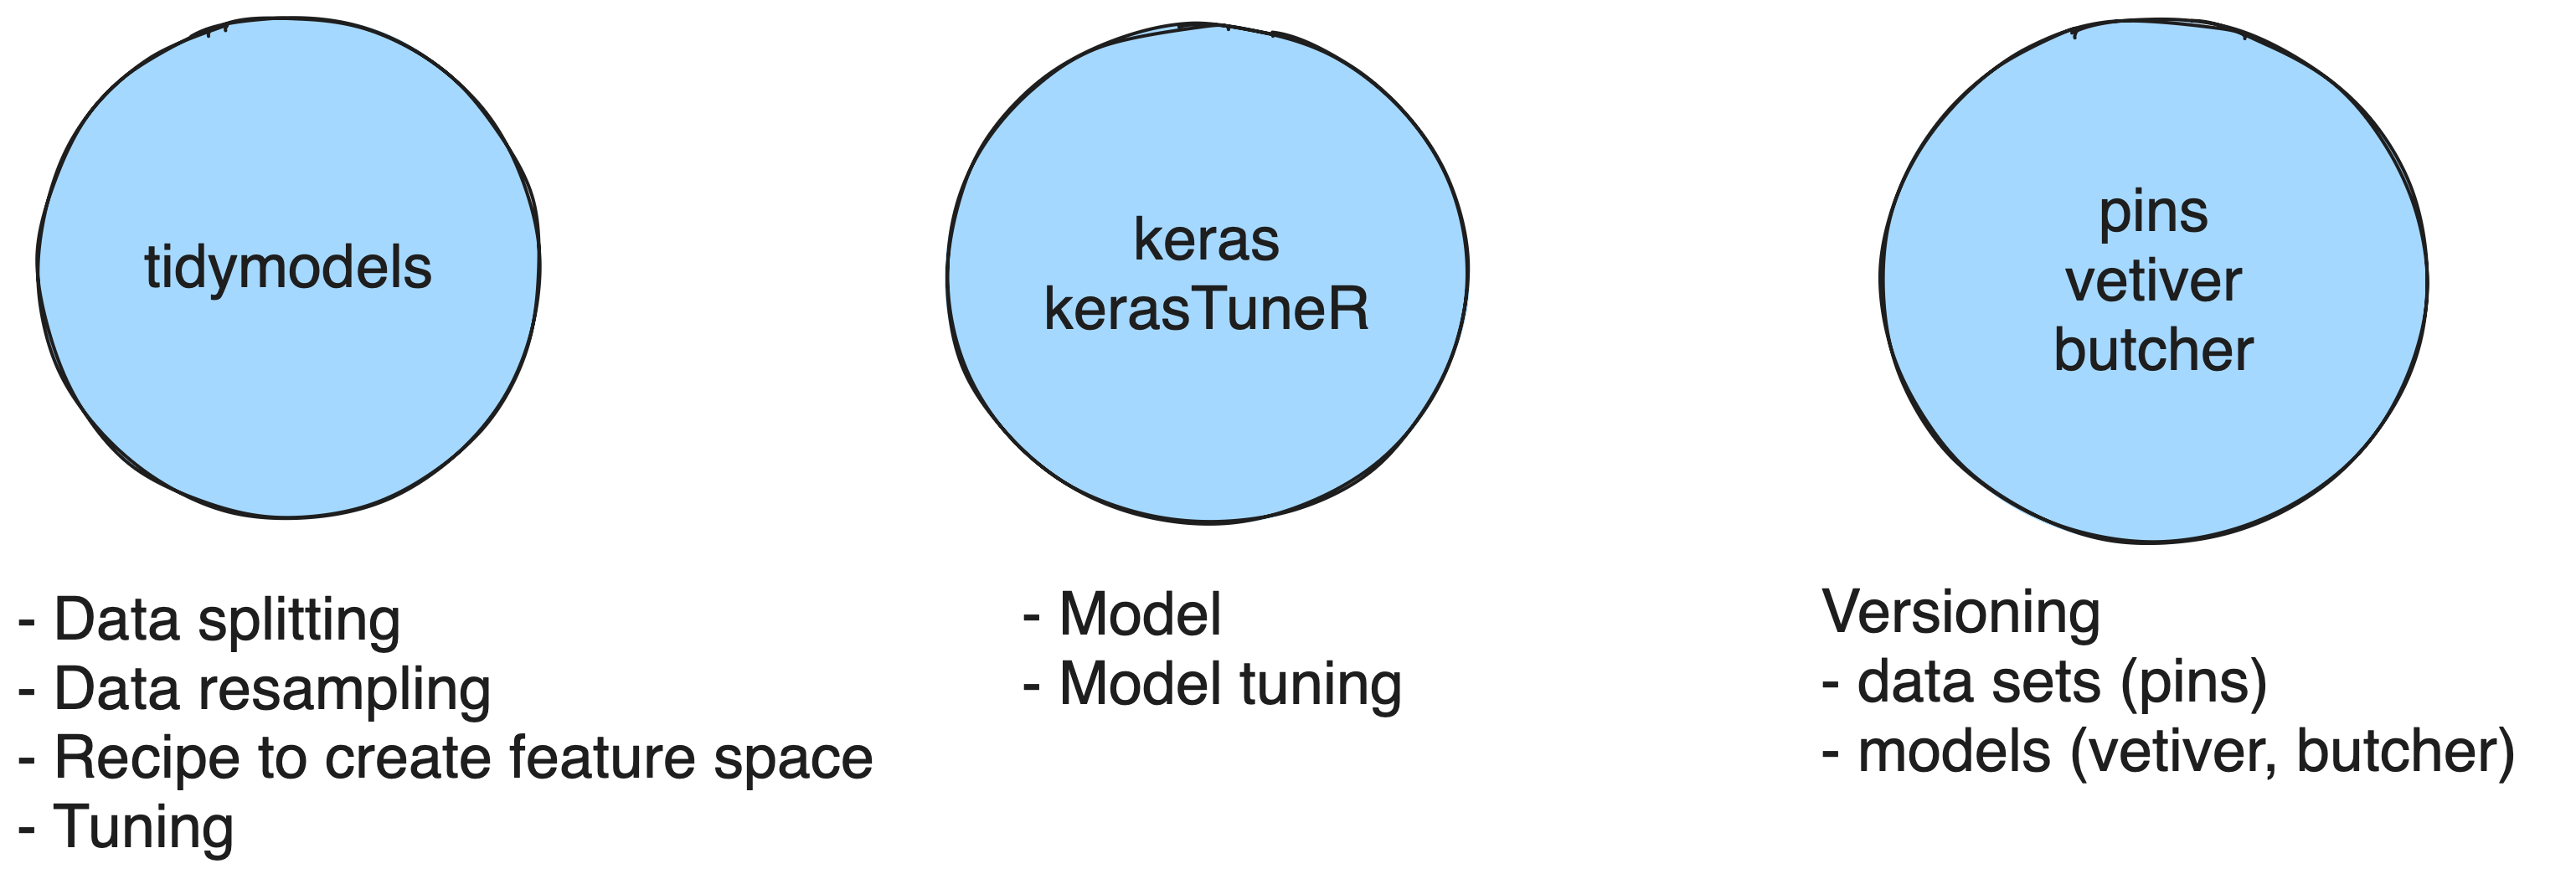
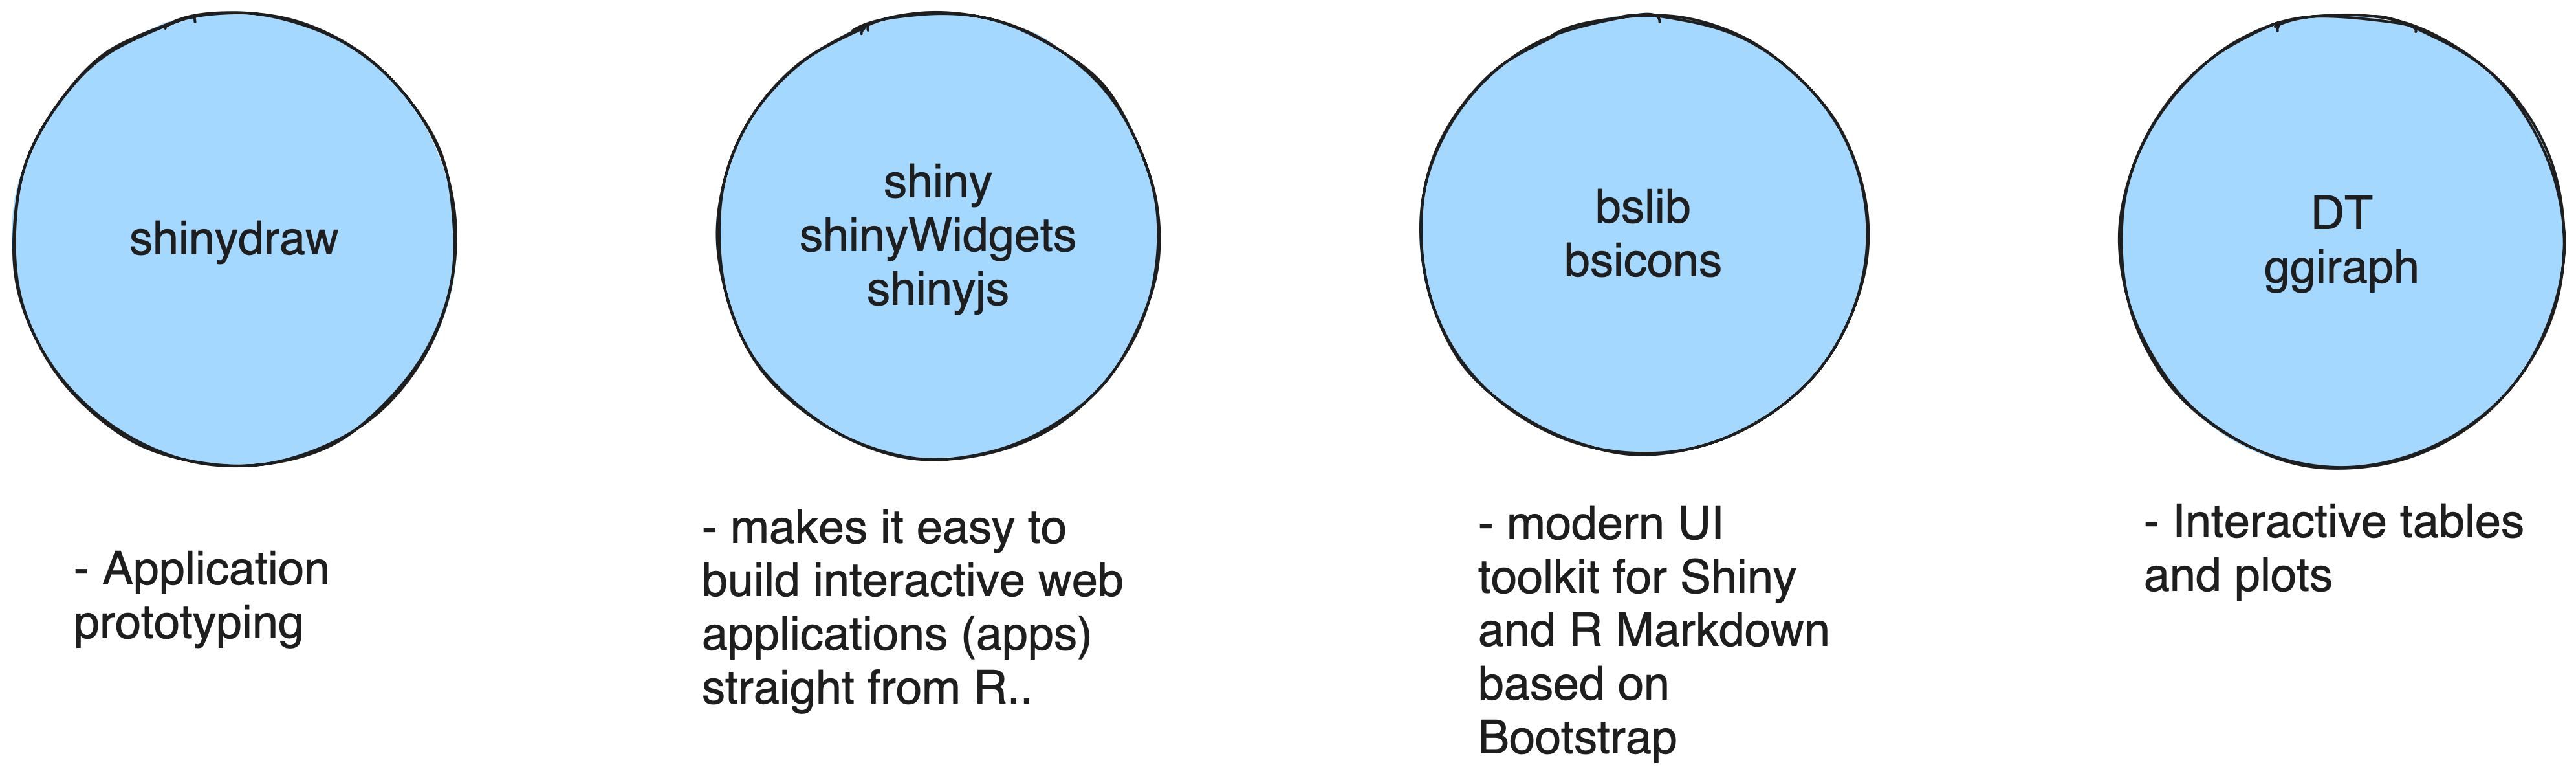
R to the rescue
Gait analysis
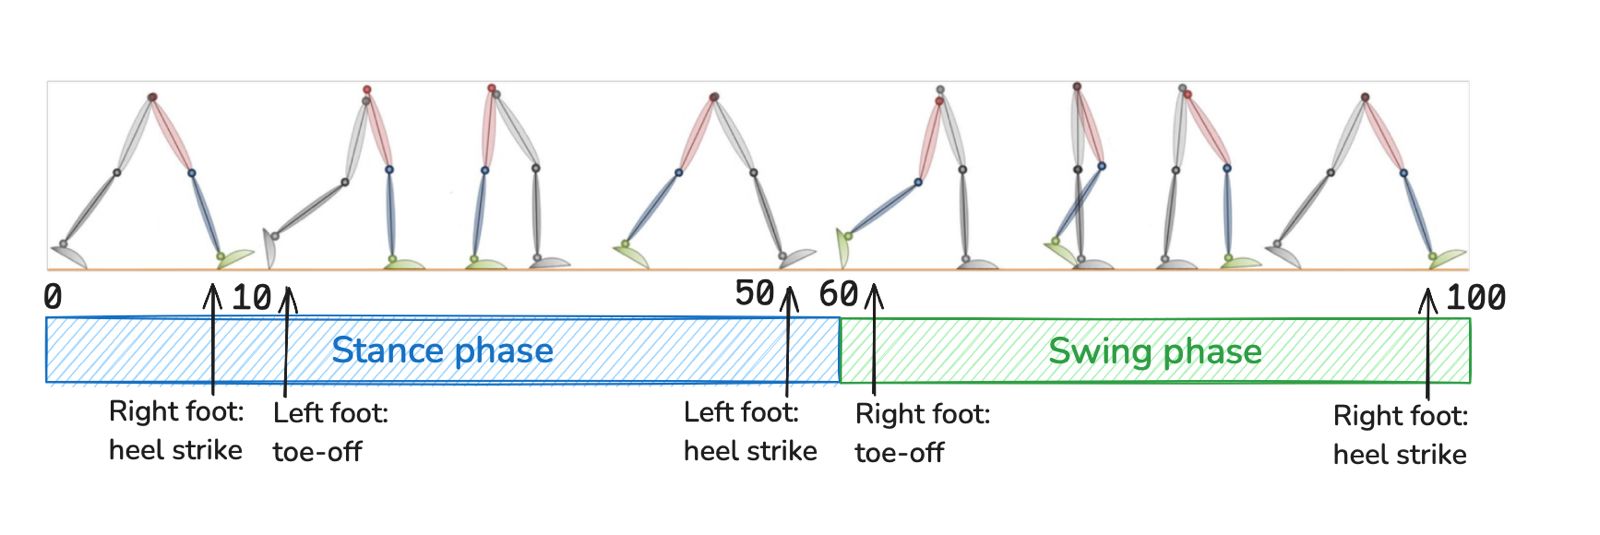
Segmentation points:
Heel strikes of right foot.
\(\Longrightarrow\) Segmentation of the raw signal into gait cycles.
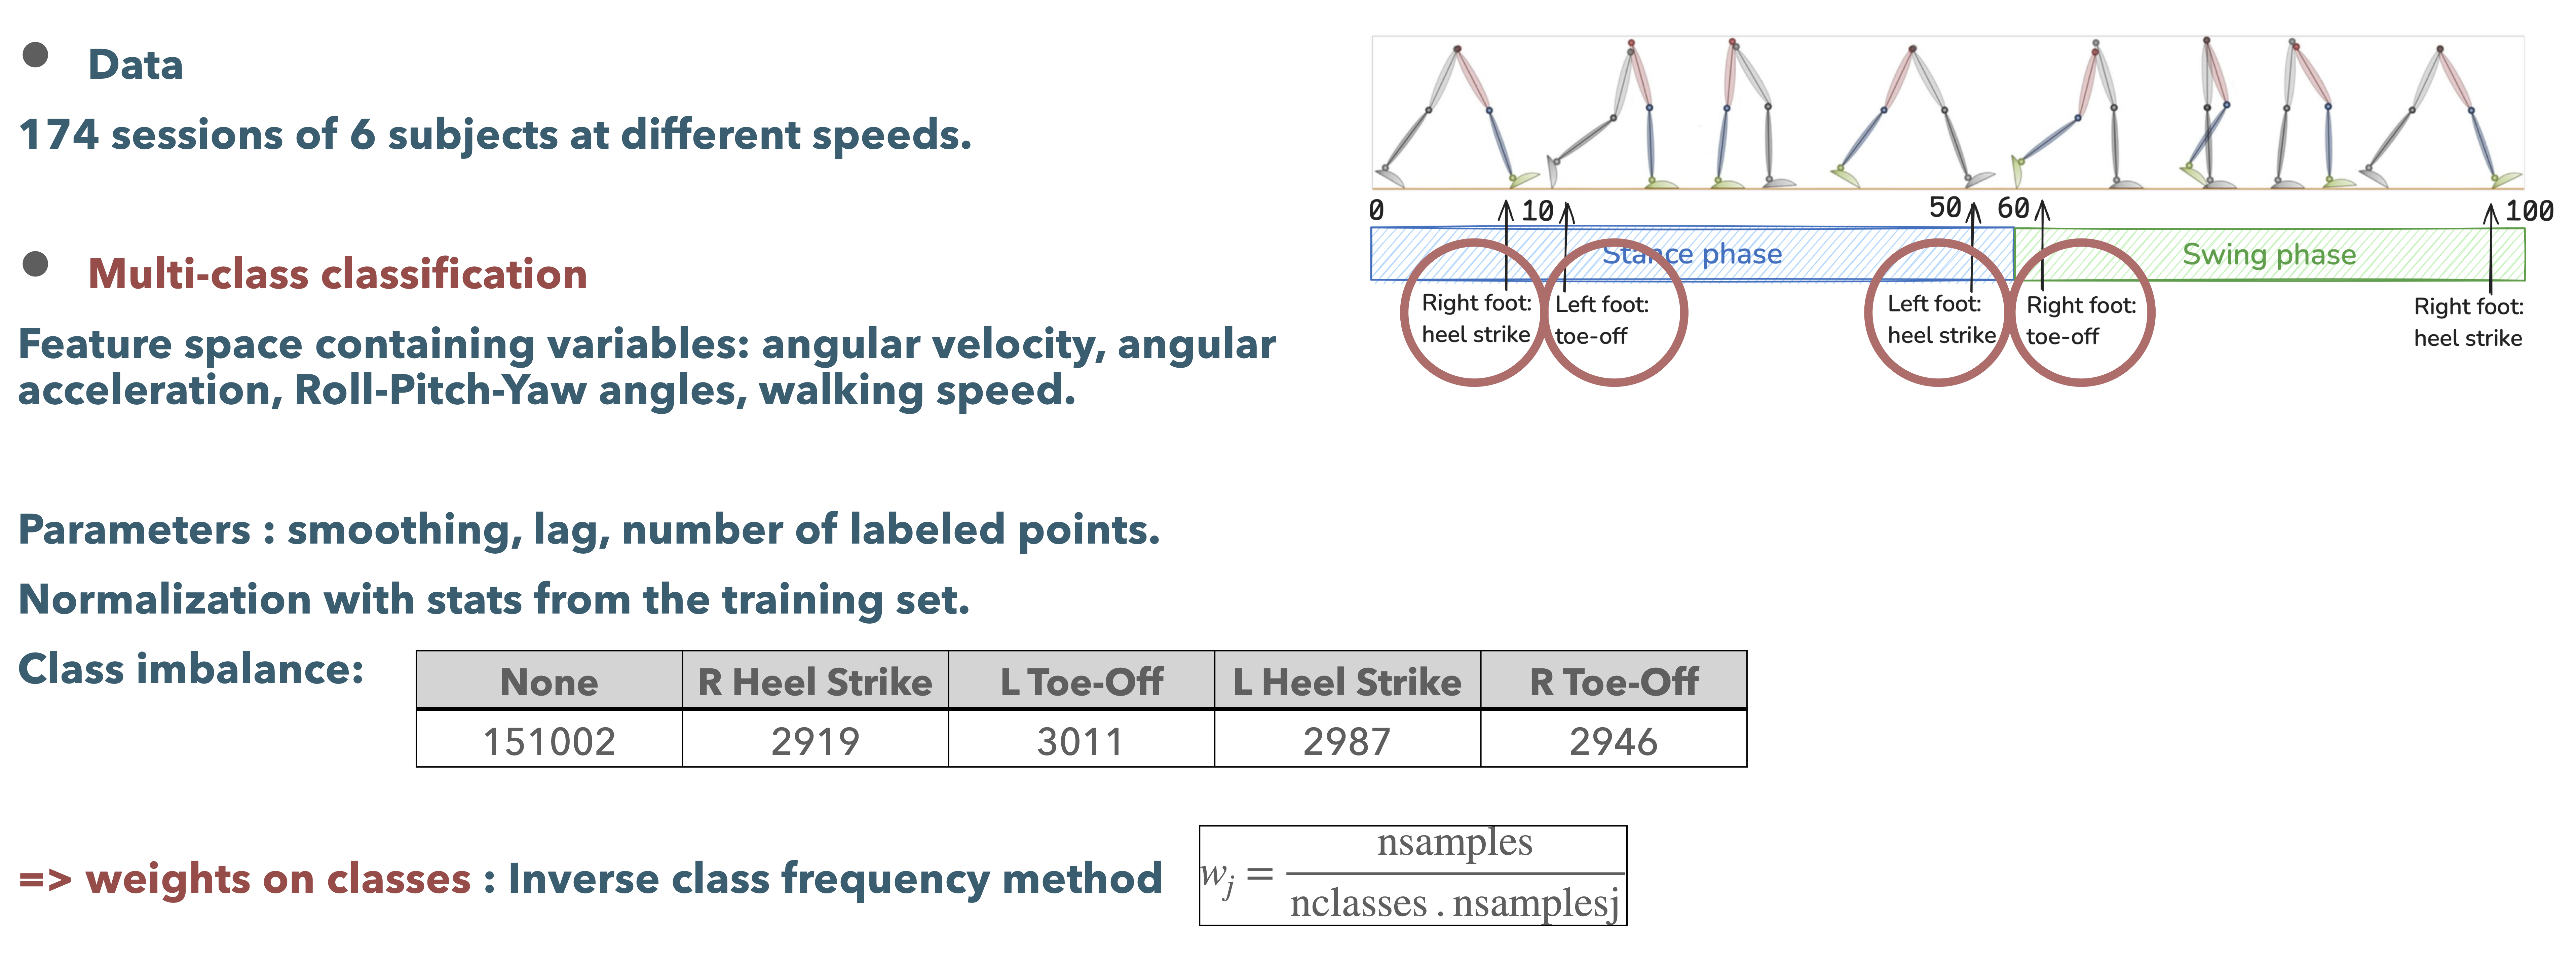
A neural network model
Time points as observations
We view the segmentation of gait cycles as a problem of classification of time points into 5 classes: Right Heel Strike, Left Heel Strike, Right Toe Off, Left Toe Off and No Event.
We collected data on a reference treadmill which provides ground truth for the segmentation via pressure sensors.
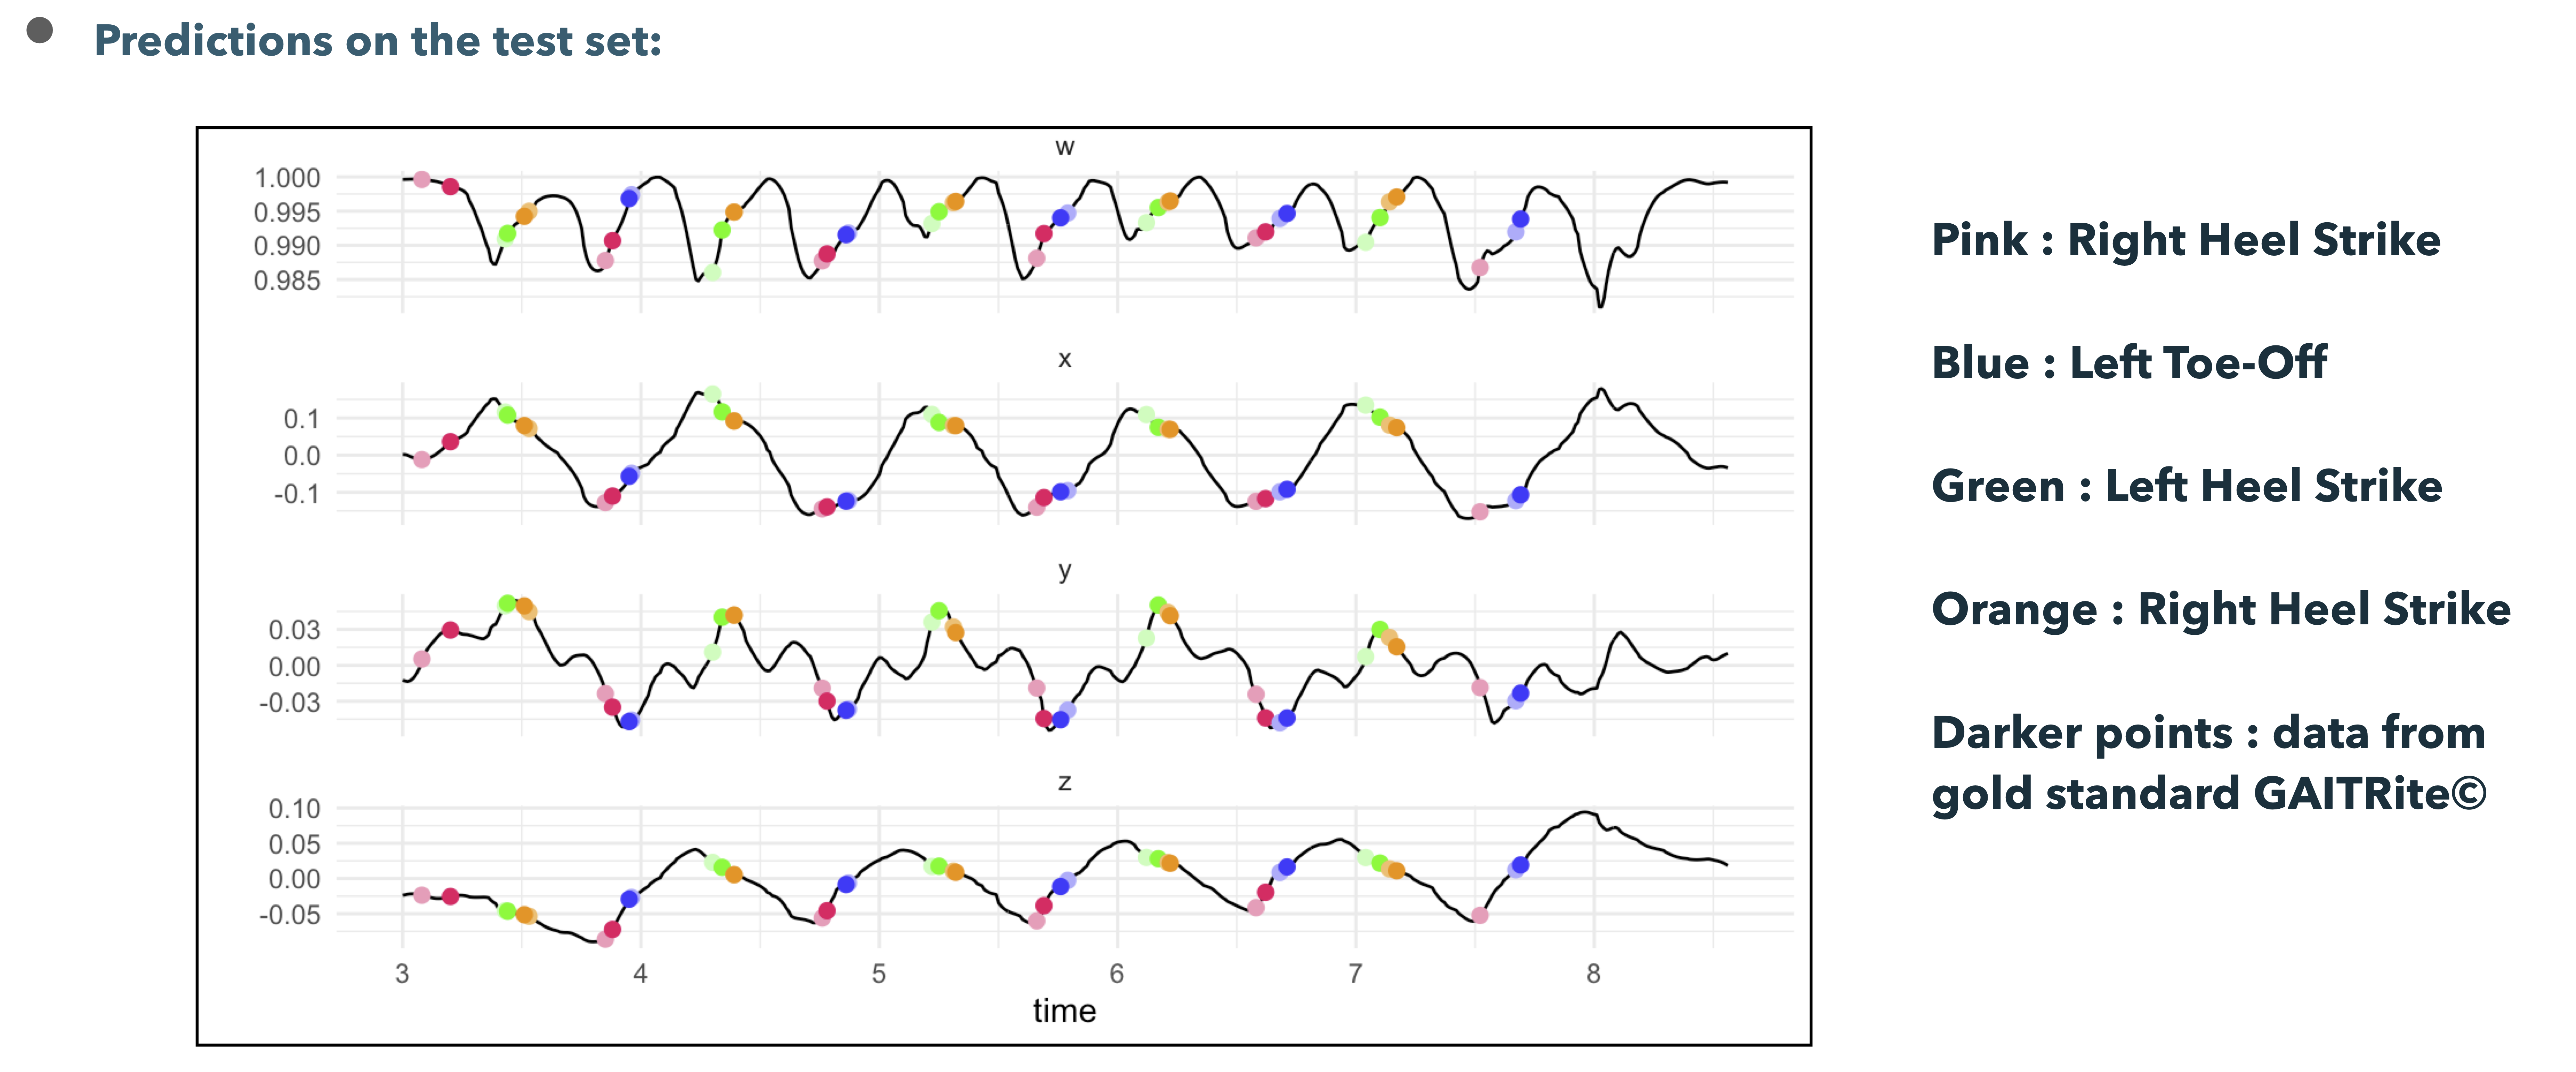
Result on test set
R to the rescue
Lie groups
Definition 1 (Smooth manifold) A smooth or differentiable manifold is a topological space that locally resembles linear space.
Lie groups
Definition 2 (Group) A group is a set \(\mathcal{G}\), with composition operation \(\circ\), that, for elements \(\mathcal{X}, \mathcal{Y}, \mathcal{Z} \in \mathcal{G}\), satisfies the following axioms:
- Closure under \(\circ\): \(\mathcal{X} \circ \mathcal{Y} \in \mathcal{G}\)
- Identity \(\mathcal{E}\): \(\mathcal{E} \circ \mathcal{X} = \mathcal{X} \circ \mathcal{E} = \mathcal{X}\)
- Inverse \(\mathcal{X}^{-1}\): \(\mathcal{X}^{-1} \circ \mathcal{X} = \mathcal{X} \circ \mathcal{X}^{-1} = \mathcal{E}\)
- Associativity: \((\mathcal{X} \circ \mathcal{Y}) \circ \mathcal{Z} = \mathcal{X} \circ (\mathcal{Y} \circ \mathcal{Z})\)
Definition 3 (Lie group) A Lie group is a smooth manifold whose elements satisfy the group axioms.
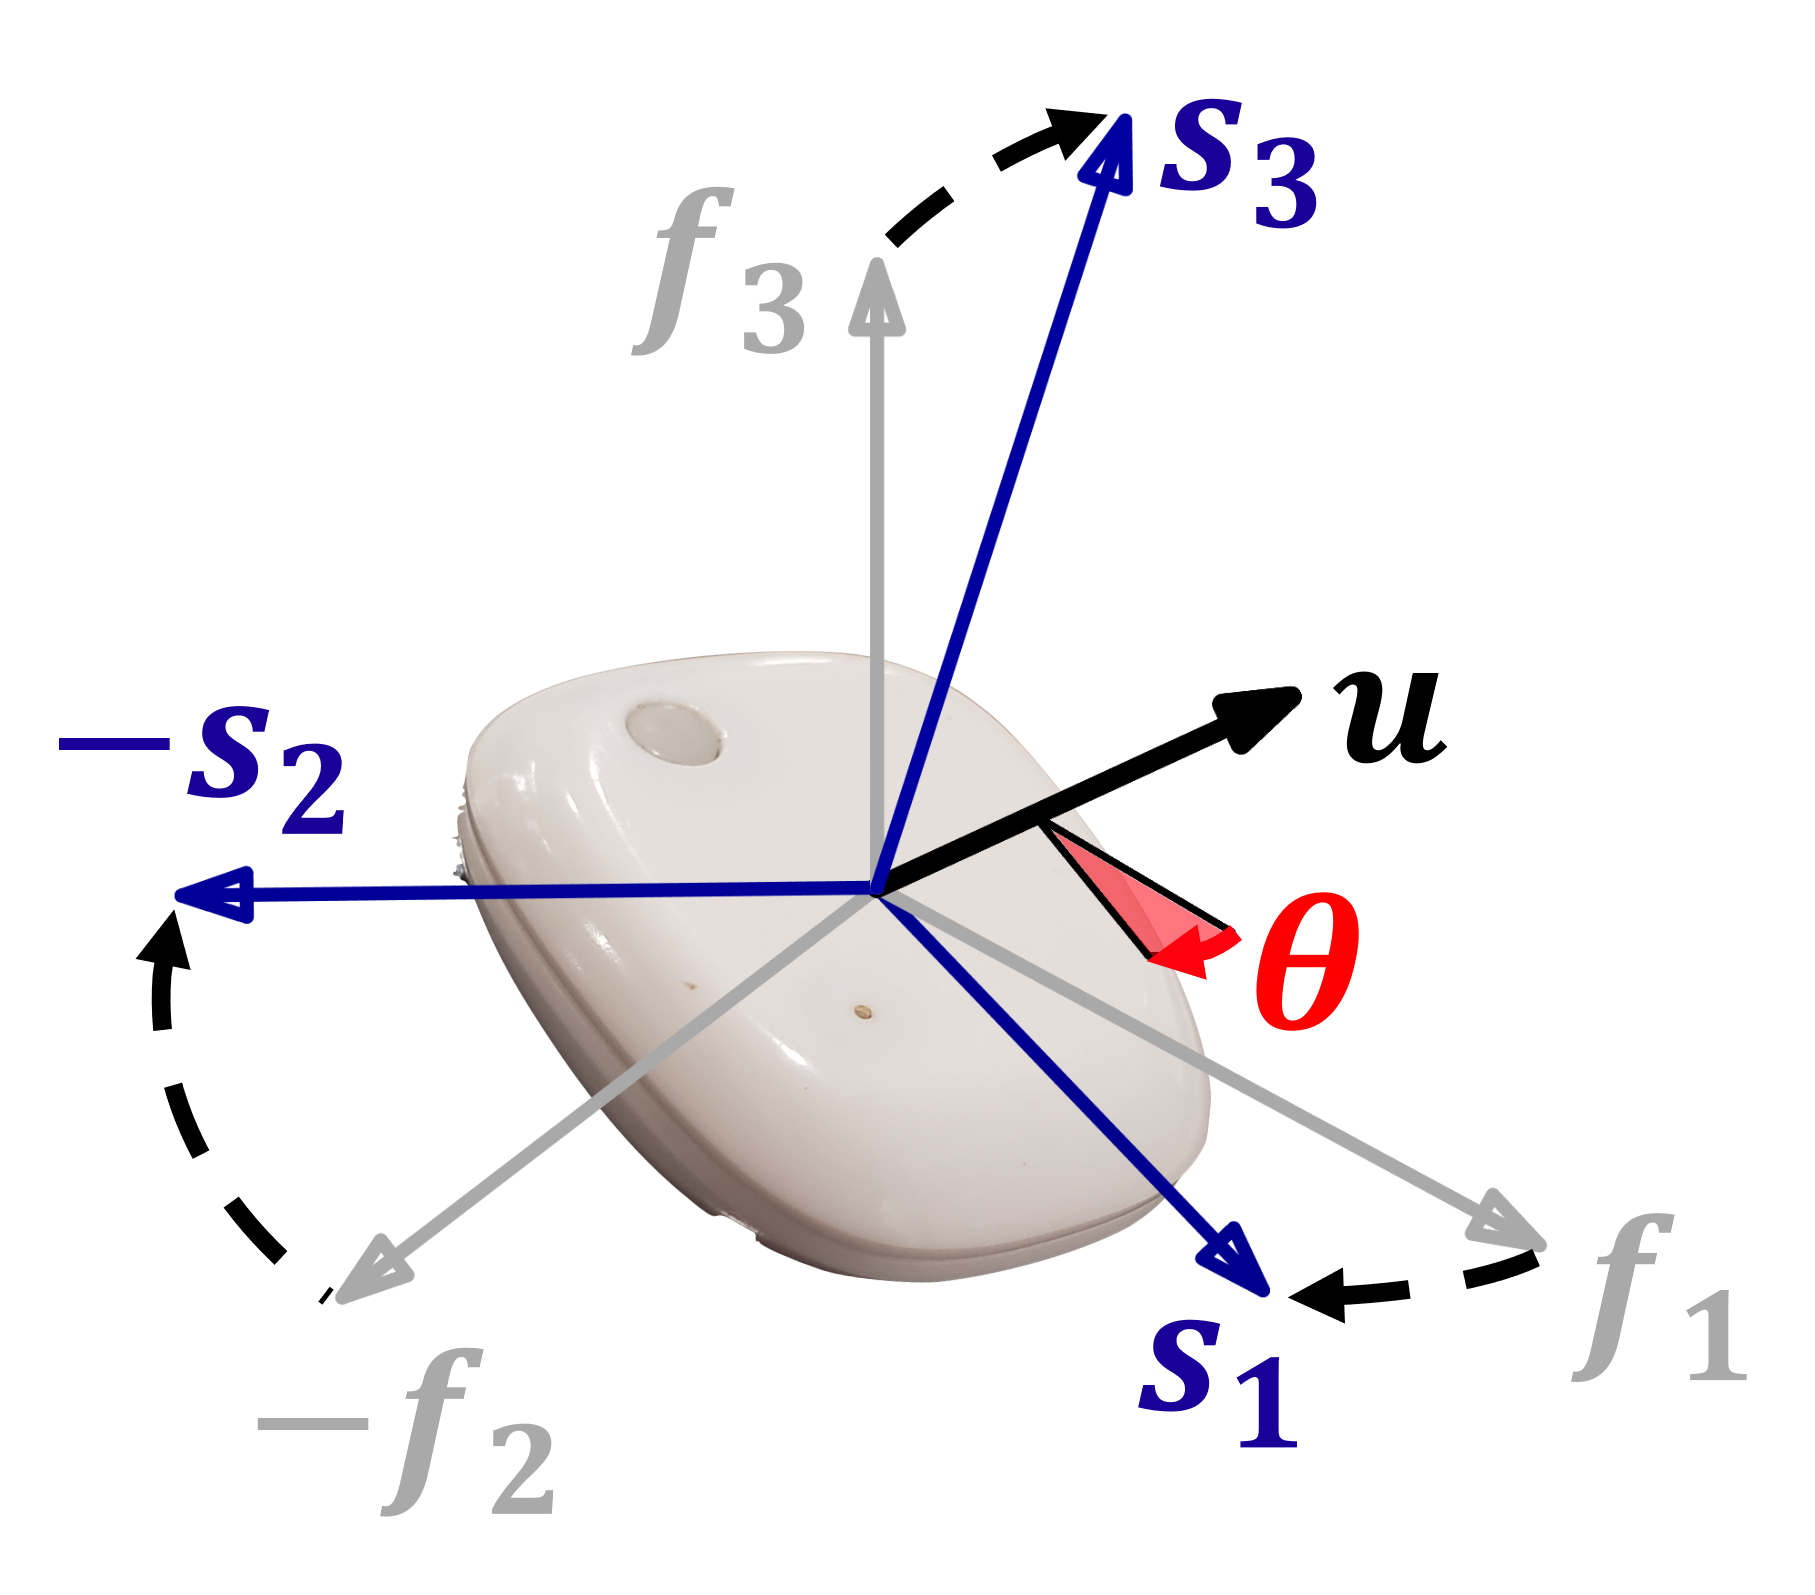
The Lie group \(S^3\) of unit quaternions
Vectors \(\mathbf{x} = (0, x_1, x_2, x_3) = 0 + ix_1 + jx_2 + kx_3\) rotate in 3D space by an angle \(\theta\) around the unit axis \(\mathbf{u}\) through the double quaternion product \(\mathbf{x}^\prime = \mathbf{q} \mathbf{x} \mathbf{q}^\star\).
R to the rescue
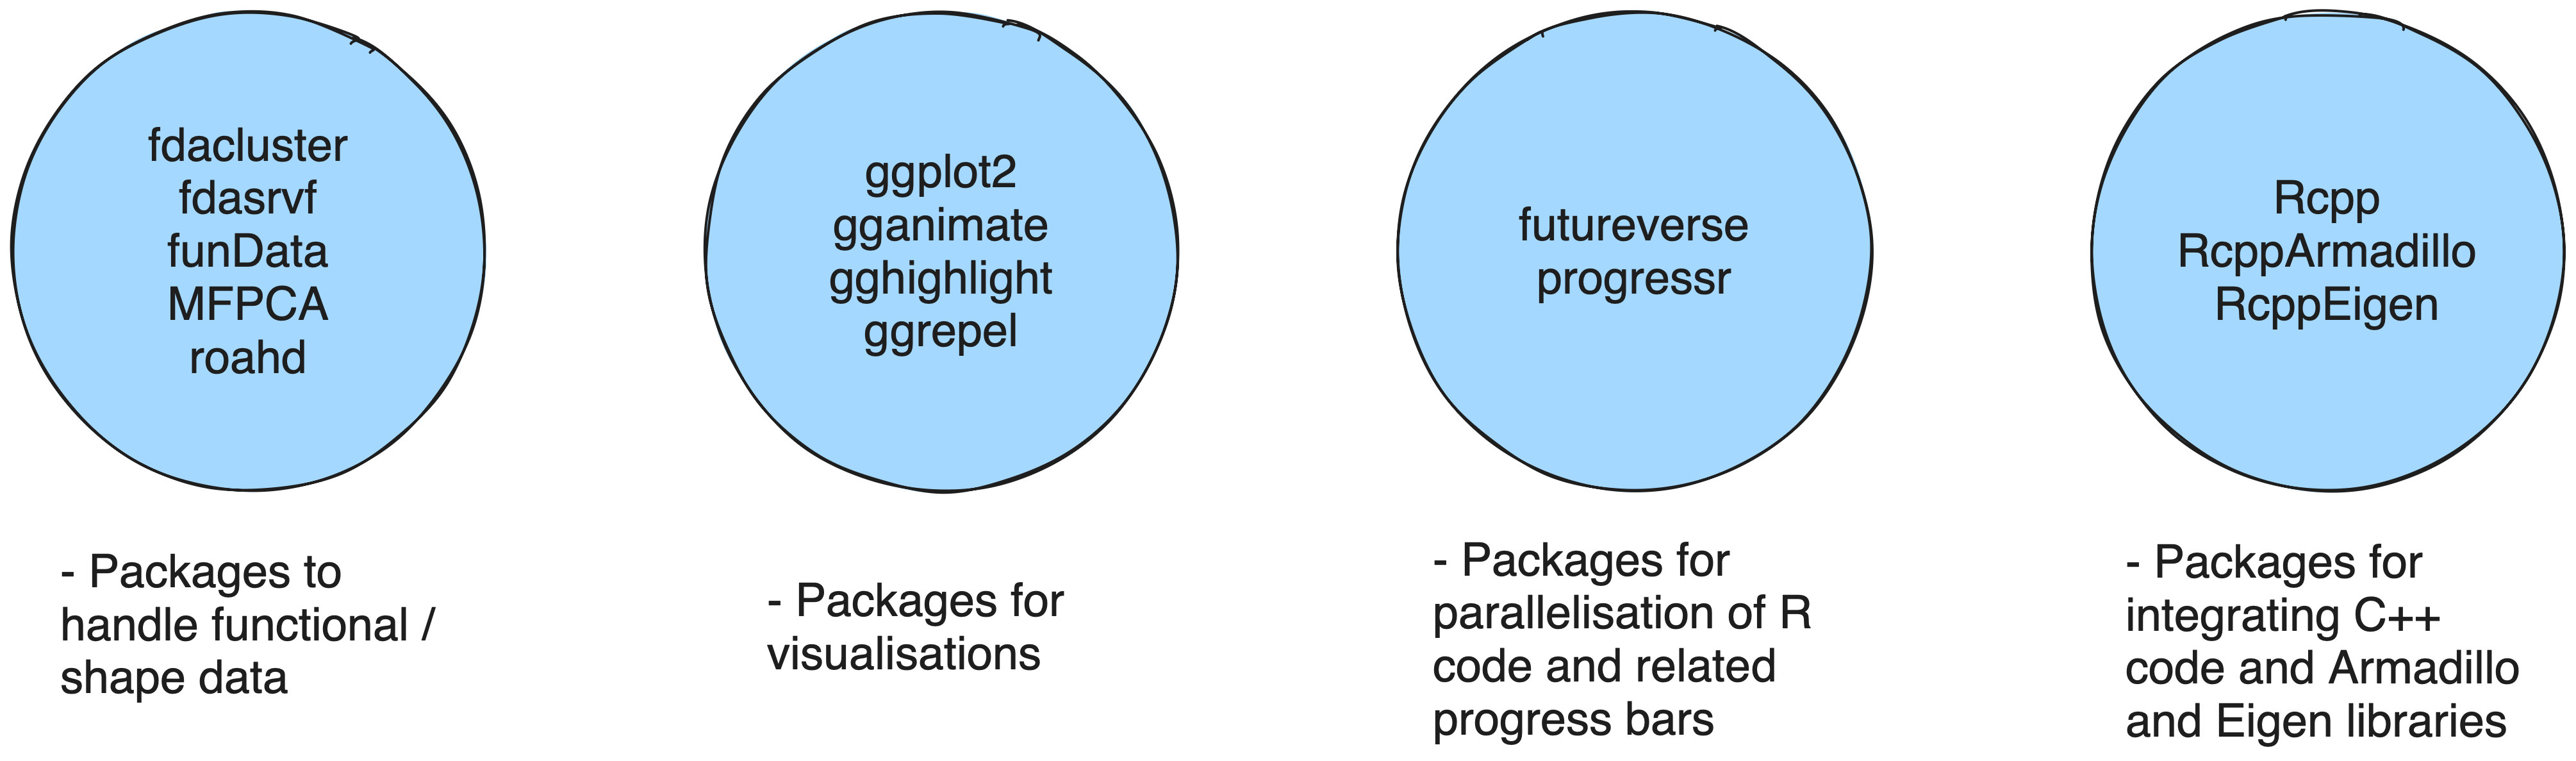
R to the rescue
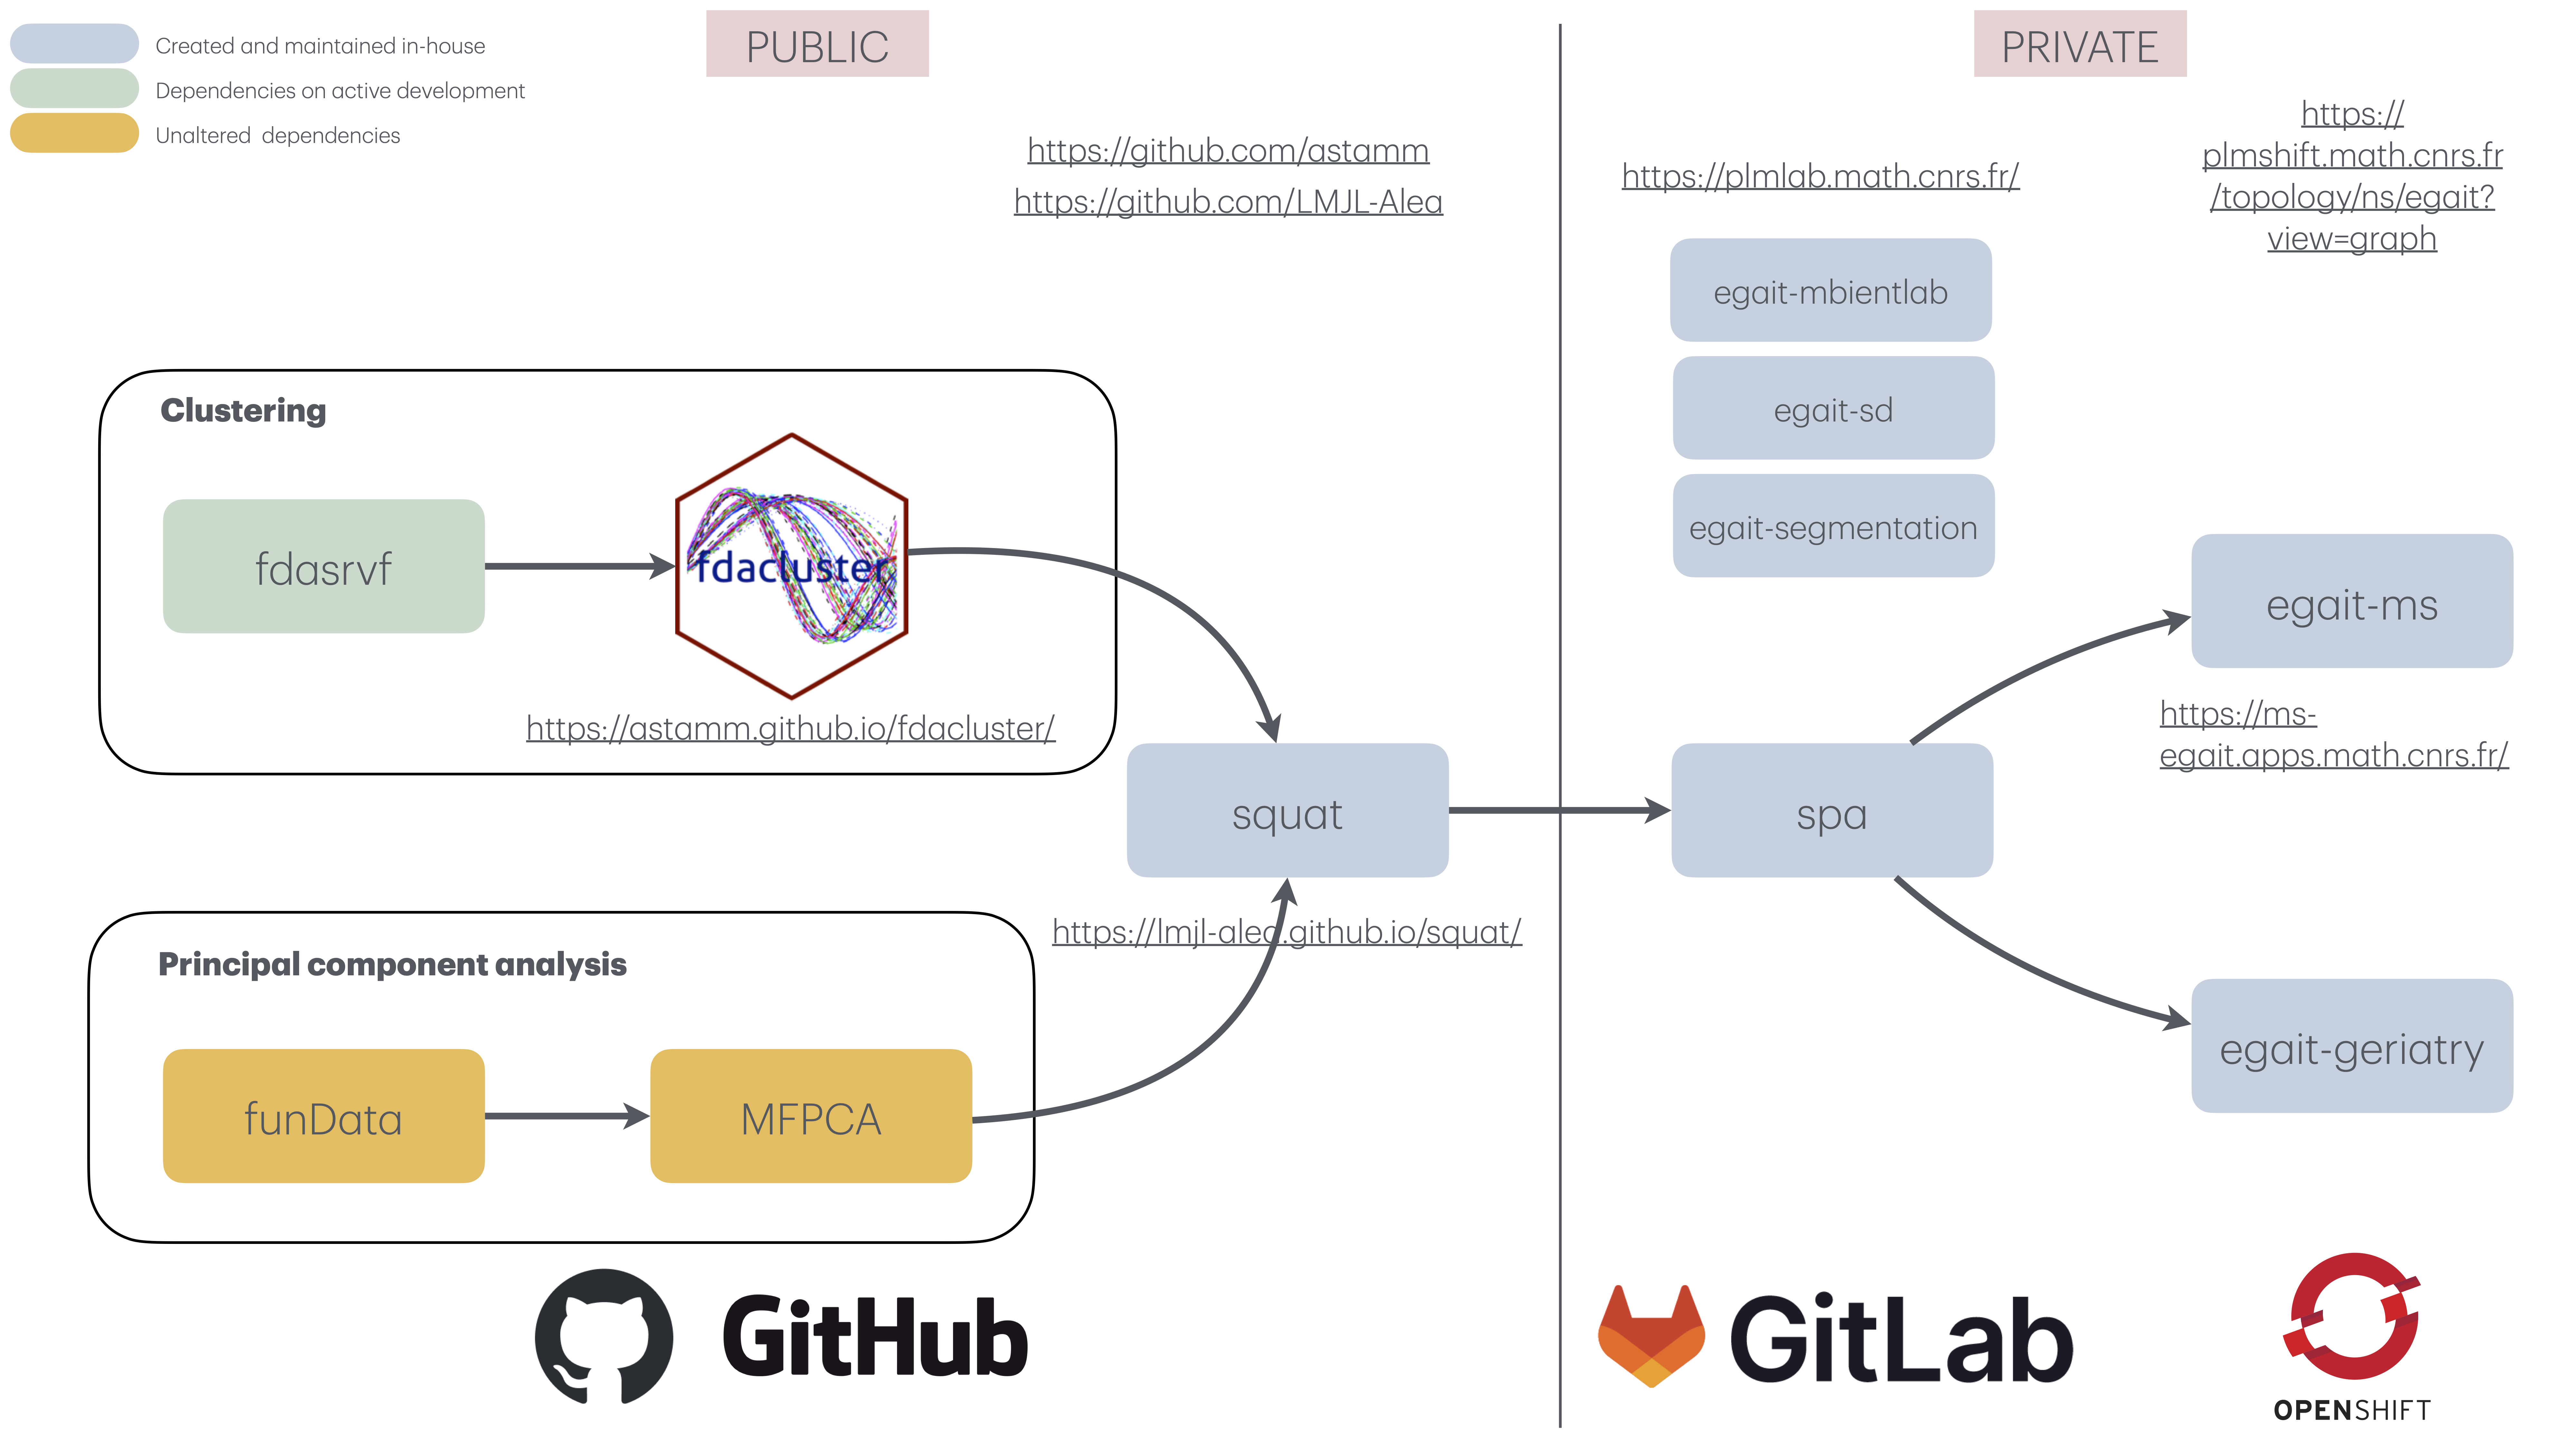
Wrappin’ up
Conclusion
- Choosing the R language for analysing the data produced by eGait has been a success in fostering collaboration between the medical and statistical communities.
- The
squatpackage provides a solid foundation for statistical analysis of quaternion time series, with a focus on computational efficiency and ease of use.