See
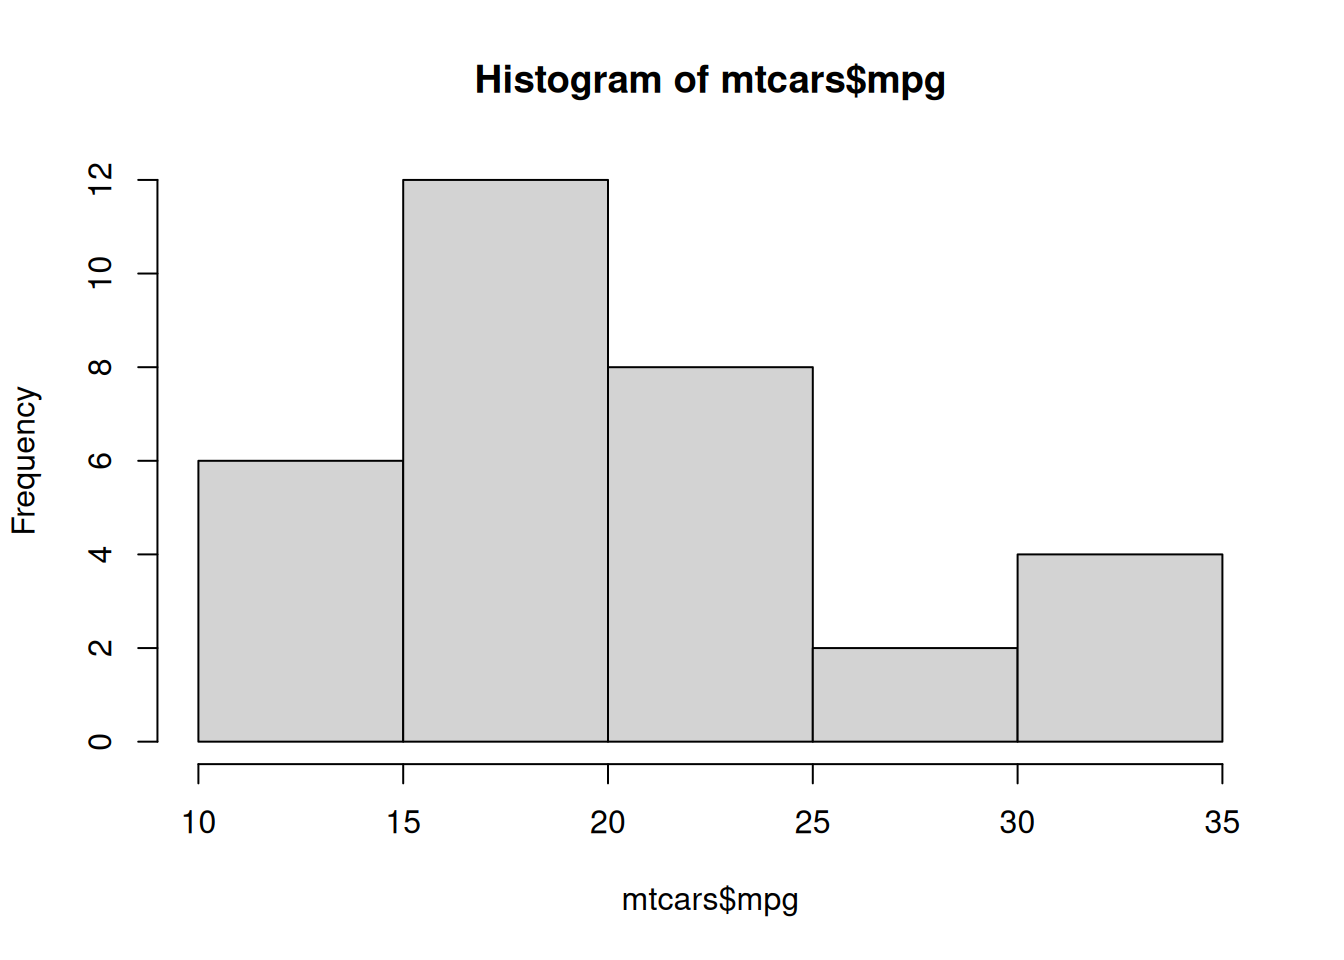
Figure 1
,
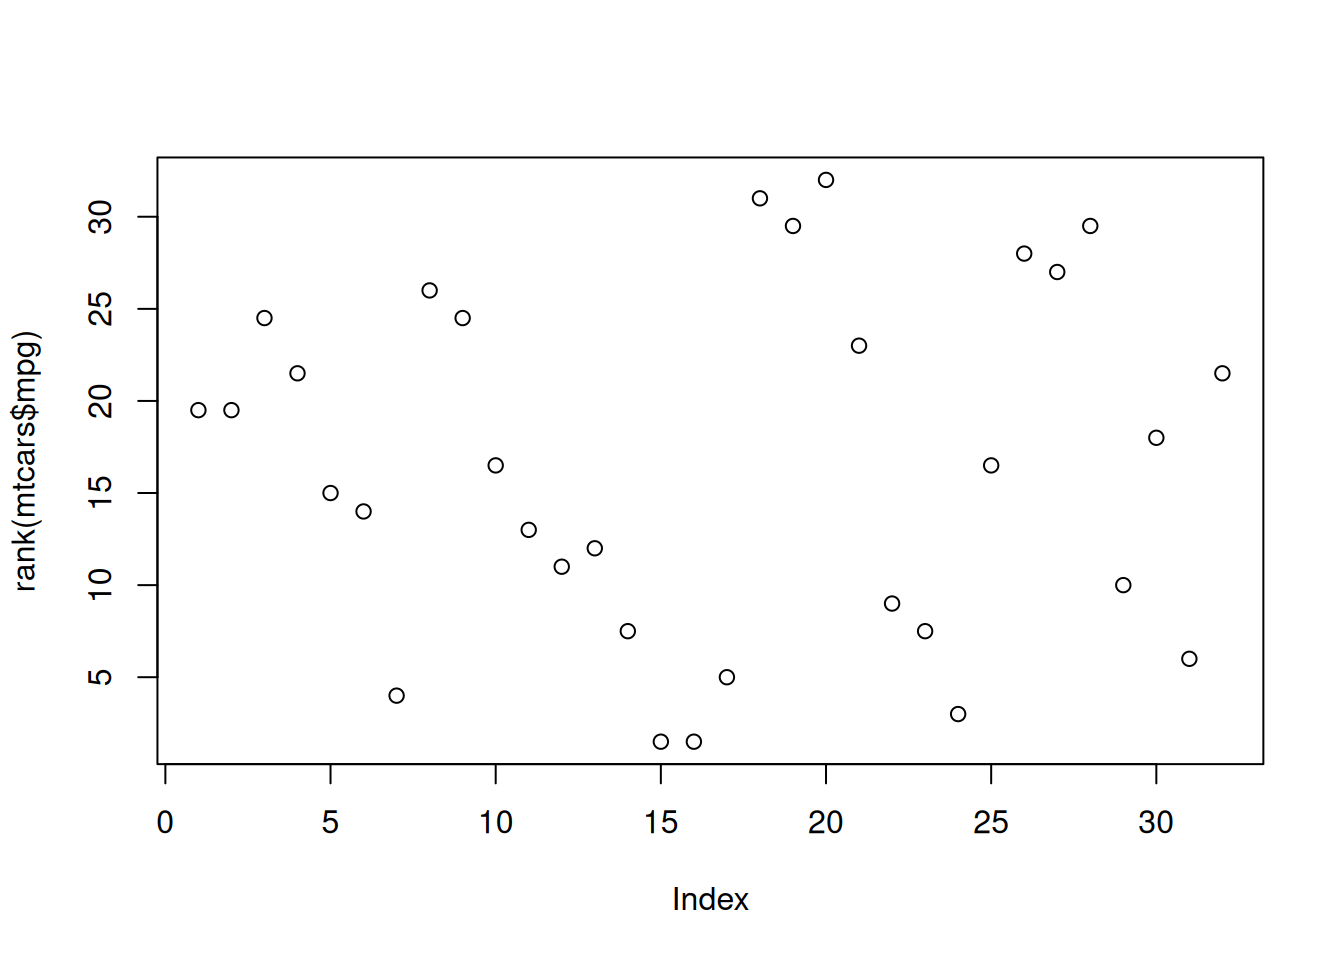
Figure 2
and
Wickham (
2016
)
.
hist
(mtcars
$
mpg)
Figure 1: Distribution of mpg
plot
(
rank
(mtcars
$
mpg))
Figure 2: Ranks of mpg values
References
Wickham, Hadley. 2016.
Ggplot2
. 2nd ed. Springer.